
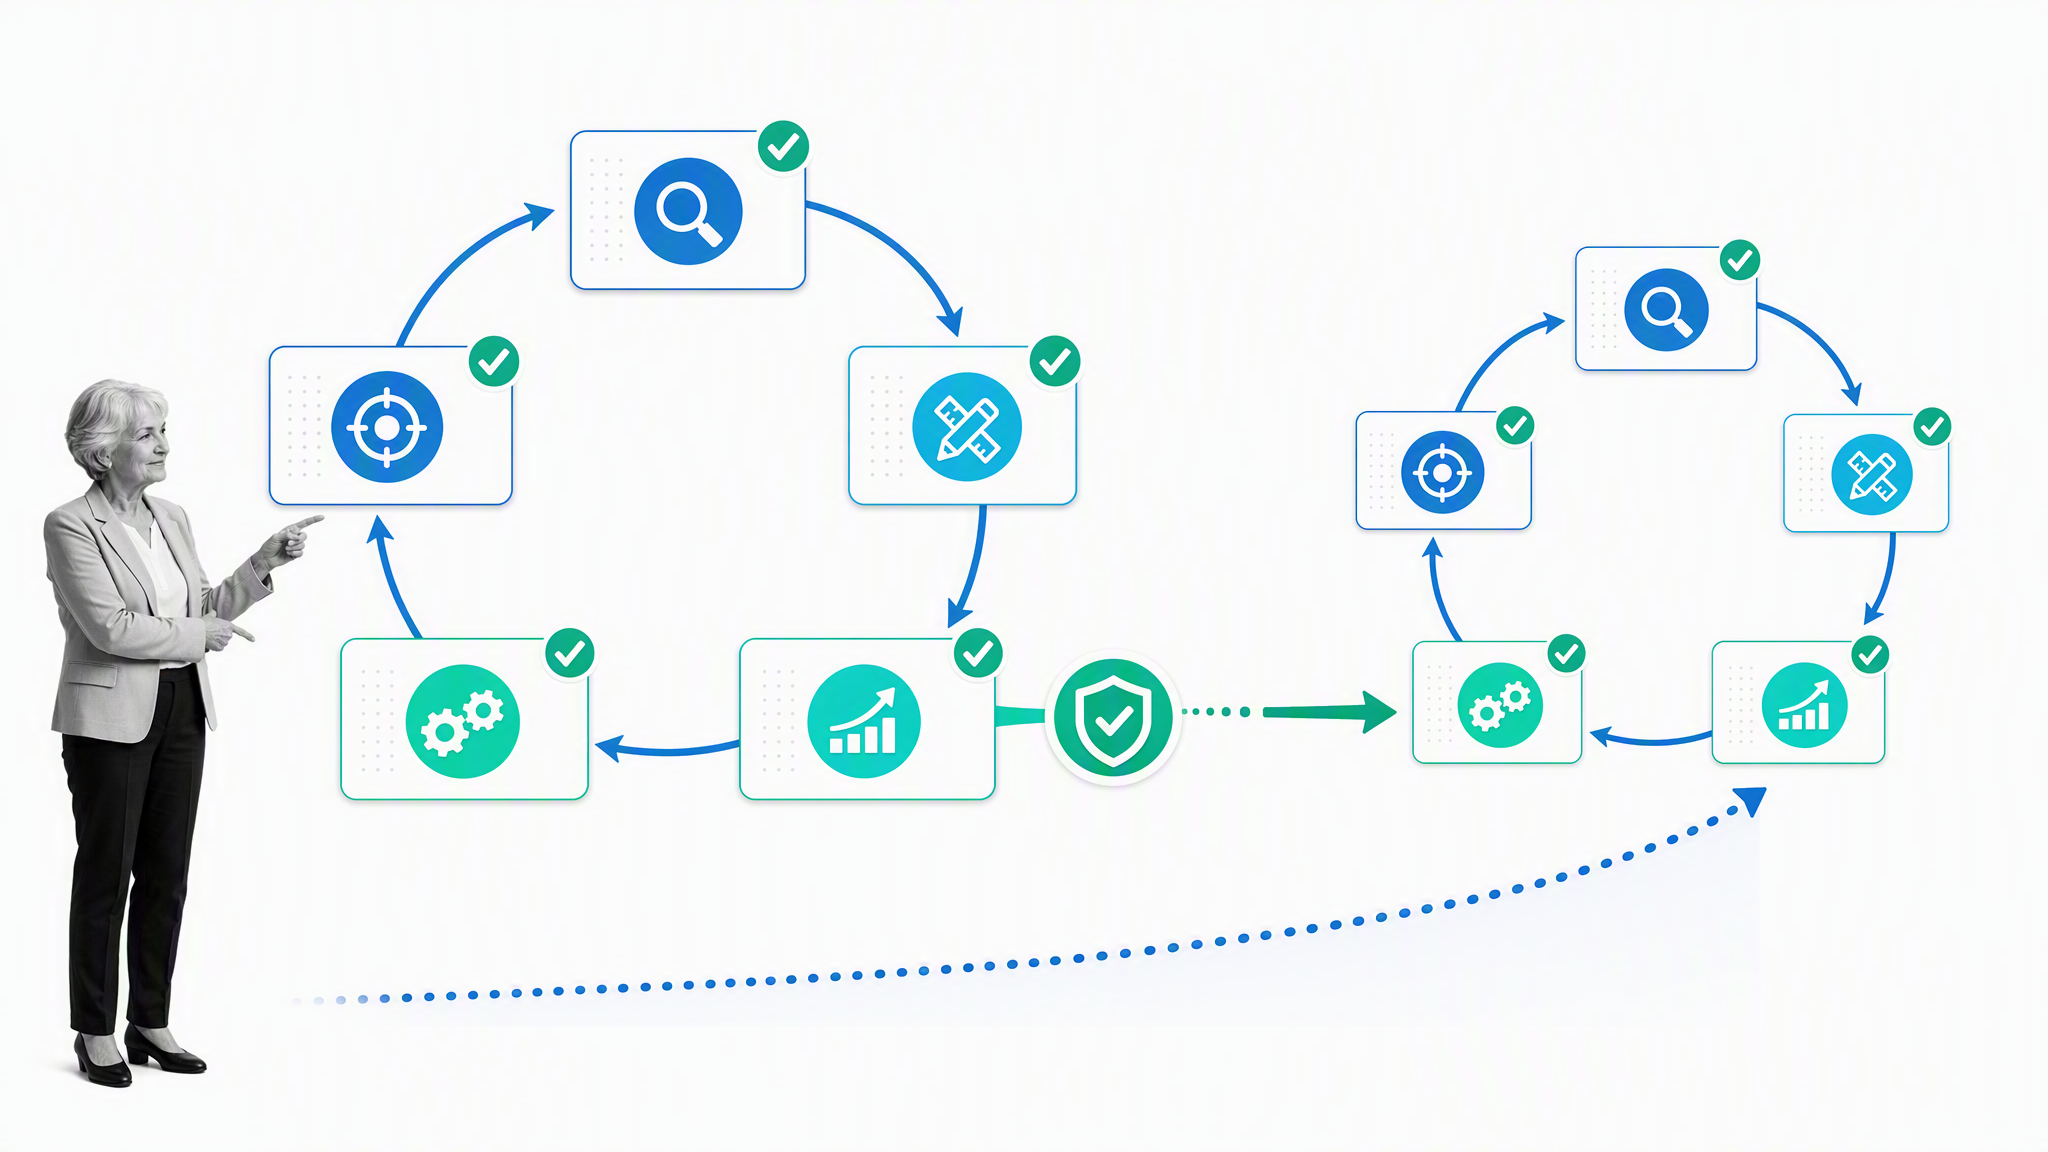
DMAIC is a five-step, data-driven improvement cycle: Define, Measure, Analyze, Improve, and Control. Used in Six Sigma, it helps teams find and remove defects in an existing process.
This guide walks through each step, the measurements and tools used at each stage, and the controls that keep an improvement from slipping back.
What is DMAIC?

- Define
- Measure
- Analyze
- Improve
- Control
When do we use DMAIC?
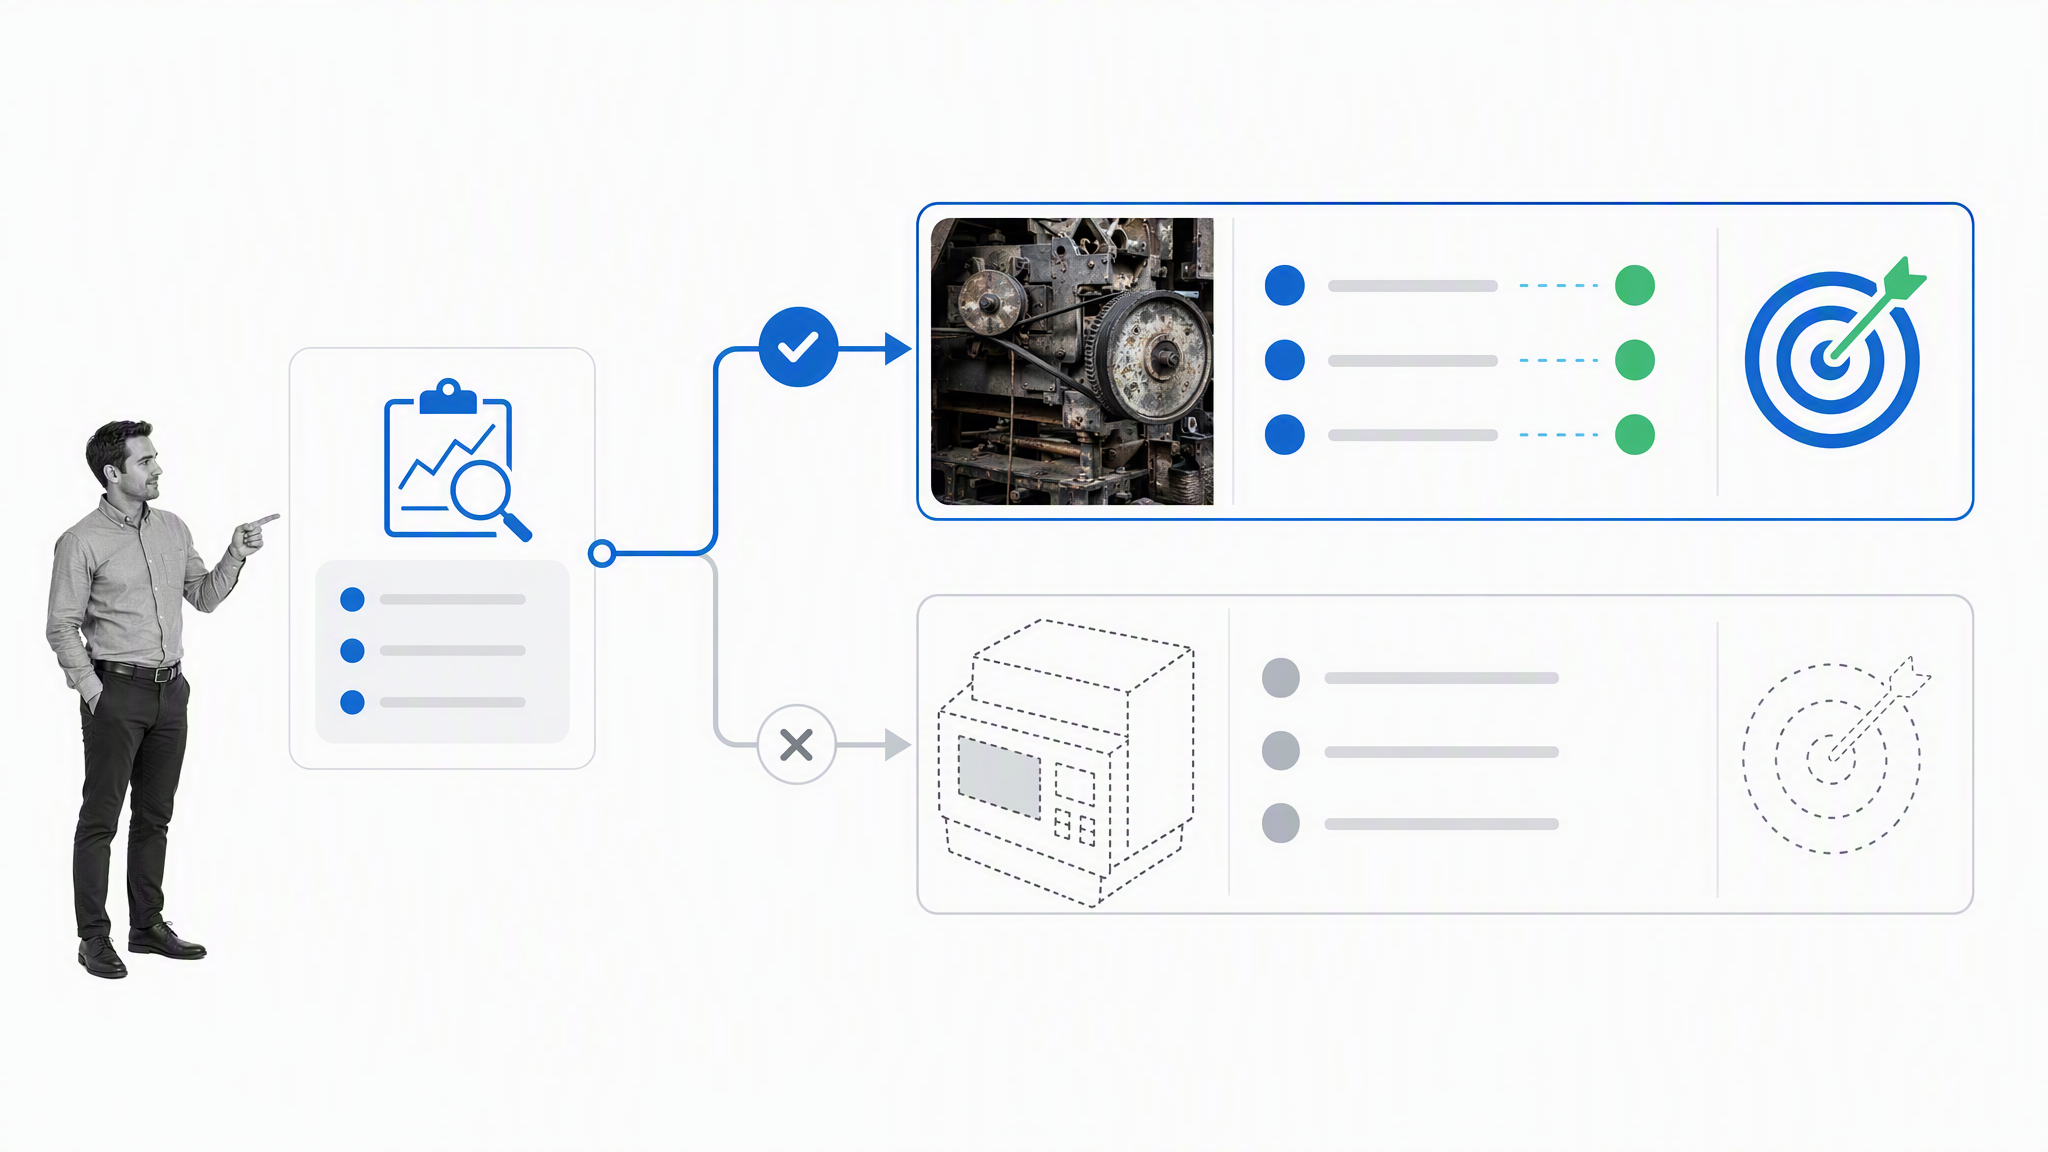
- There is an obvious problem of some form with an existing process or set of processes.
- The potential is there to reduce variables like lead times or defects while improving variables like cost savings or productivity.
- The situation is quantifiable; the process itself involves measurable data and the results can be appropriately understood through quantifiable means.
Define: Map the project and understand your aims

Define Customers and Requirements
How you carry out this stage depends on who your customers are. There are two subsections of customers, either internal customers or external customers. Internal customers are levels of management within your organization or other departments who are reliant on the output of the particular process you are attempting to improve. External customers would be the end users of your product or services. These are normally the end users, buyers, or business clients who receive the output. We tend to divide the expectations of these customers into two related categories: needs and requirements. Needs refer to the end goals of a product: someone buys an air-conditioning unit because they want to keep a room cold. Requirements refer to features or aspects of a product: an air-conditioning unit needs to have a thermostat of some description in order to deliver the cold room the customer needs. When judging the output of a process, we analyze who the customers are, what their needs are, and what the requirements are to fulfill these needs.Develop Problem Statement, Goals and Benefits
The next step is to bring that customer information into actionable steps. We want to develop a clear Problem Statement in order to communicate the purpose of the process and to help us understand how our actions will relate directly to the end results. This should not look to define the solution, but instead focus on the following aspects:- What is the pain point?
- Where is it hurting?
- When has it been hurting? Is it long term or short?
- What is the extent of the pain?
“In the last 3 months (when), 12% of our customers are late, by over 45 days in paying their bills (what) . This represents 20% (magnitude) of our outstanding receivables & negatively affects our operating cash flow (consequence) .”In doing so, we should clearly define what our ultimate goals will be from the process improvement work we undertake. This might be identifying something simple like a need to increase output per hour from 100 units to 200 units. Or it might be improving clearly measurable rates of customer satisfaction or other similar quantifiable variables. In a pure Six Sigma approach, your goal would be to improve your Sigma baseline and reduce whatever your defined defects are – but we’ll come to all that later. The goal statement should be SMART: Specific, Measurable, Attainable, Relevant and Time Bound. The Six Sigma Institute example:
To reduce the percentage of late payments from 12% to 8% in the next 3 months, and give tangible savings of 500K USD/ year.
Identify Champion, Process Owner and Team
In order for us to implement this process improvement, we need to determine the roles of different employees in bringing the project to completion. Different companies will put differing emphasis on roles, so take the following as an example as much as a definition. If you’re familiar with lean methodologies like Scrum, this will quickly make sense to you. The Process Owner is the person who is responsible for the process improvement project. This is the hands on position where the person involves themselves with each team involved in the process, analyzes and tracks data and output, and looks to manage the process from above from the first step to the last. The Process Owner’s primary function is to provide the planning and overview to allow everyone else to flourish. The Process Champion is an individual within the organization who has the power to make key decisions and facilitate the work of the Process Owner. This would likely be an executive who can help allocate resources to serve the needs of the Process Owner. The Champion aims to remove barriers which the Process Owner is facing and help facilitate the process improvement project from another step above. The team in this context are the employees who will be putting the desired changes into action and helping monitor the effects of these changes. The main person in this team is the Black Belt; the project manager for the team. The other employees who focus on the Six Sigma process might be referred to as Green Belts (at this point it starts to feel a little like a karate kid cosplay).Define Resources
In order to undertake this process improvement project, we need to know what resources are available for the Process Owner to utilize. This might include a budget for contracting external services, purchasing additional tools, or travel expenditures. It might also refer to how many staff will be needed in order to make this change effectively; do staff need to be brought in from other departments, or will new staff need to be hired? The amount of resources required will be defined by the problem and goal statements. You don’t want to spend $1 million to save the company half a million. We need to understand what resources are needed to tackle the project and what resources are reasonably available.Evaluate Key Organizational Support
Now you know what resources you need to begin the project, you need to know what support you can gather from other actors within your organization. The Process Champion will be in charge of attempting to mobilize this support from other areas of the company. In order to do this, the Process Champion will likely try to create a Business Case. The purpose of a Business Case is to demonstrate the importance of this process to the broader operations of the company. The Six Sigma Institute give us an example of 7 questions which a Business Case should answer:- Why is the project worth doing? Justify the resources necessary to engage in the project.
- Why is it important to customers?
- Why is it important to the business?
- Why is it important to employees?
- Why is it important to do it now?
- What are the consequences of not doing the project now?
- How does it fit with the operational initiatives and targets?
By reducing the average transaction length, the queue would be able to enhance the Speed of Resolution and assist the end-users in fastest possible manner. This will not only help in achieving client targets but also increase end-user satisfaction score by offering lesser turn-around time.… although a full Business Case should include more detail and more clearly address each of the above questions.
Develop Project Plan and Milestones
We should now be in a position where we understand the different requirements, the available resources, and role allocation. At this point, we can begin to develop a detailed project plan with attainable and realistic milestones. The first step of our project planning is to develop our project scope. In doing so, it is useful to use both longitudinal and lateral scoping. Longitudinal scoping relates to the length of the process, whereas lateral scoping refers to the breadth. For example, if I was to analyze the process I use to write articles, the longitudinal scope would stretch from having the idea for the article to the moment the article goes live. That’s the scope of the process I would be investigating; with a clear start and end date. The lateral scope would be the scope of my investigation. Am I going to analyze only the process of writing this article? Am I going to analyze the process repeatedly over a period of 6 weeks? Am I going to analyze my process and the same longitudinal process of my colleagues over that period too? Think of it as the scope of the process vs the scope of the investigation. Once we have this in place, we can look to lay out milestones for when different key moments in the DMAIC process will be achieved. What date will we begin the first step of the Measure stage? What date will we commence the Improve stage? When will we complete the DMAIC process? It is recommended to set aggressive milestones as efficiency savings benefit from being brought in sooner rather than later, naturally. However, setting milestones which are too aggressive can result in what’s called “band-aid” solutions; where quality is sacrificed in order to reach arbitrary targets.Develop High Level Process Map
In order to have a clear and easy to understand overview of the planned DMAIC process, it is useful to draw up a high level process map. This will serve to demonstrate to each individual player where they fit within the process and how their role relates to the next. You can use tools like LucidChart to help you create process maps and diagrams simply and effectively. If you want to read more about process mapping and other in-depth process overview techniques you can read this article of ours: BPMN Tutorial: Quick-Start Guide to Business Process Model and NotationMeasure: Gather the data to understand performance
Define Defect, Opportunity, Unit and Metrics
At the beginning of the Measure stage, we need to first define what we should be measuring. To do this, we’ll need to understand a couple of key terms:- Unit in the Six Sigma context refers to a single item of the product. This is our smallest indivisible point of reference.
- Defect refers to a problem with the product which has arisen from an issue in the process.
- Opportunity refers to the potential points within a process where the possibility for a defect occurring is present.
- Defects per unit (DPU): number of defects / total number of units
- Defects per opportunity (DPO): number of defects / (number of units x number of defect opportunities per unit)
- Proportion defective (p): number of defective units / total number of units
Develop Data Collection Plan
In order for us to make the necessary calculations, we need to gather our data about the process. To do so we will create a data collection plan which will outline our approach and help us clarify our methods. This analysis will focus on the minutiae of what exactly we want to measure, how the data will be collected, and the methodology by which we want to handle the data, including:- How many observations are needed
- What time interval should be part of the study
- Whether past, present, and future data will be collected
Validate the Measurement System
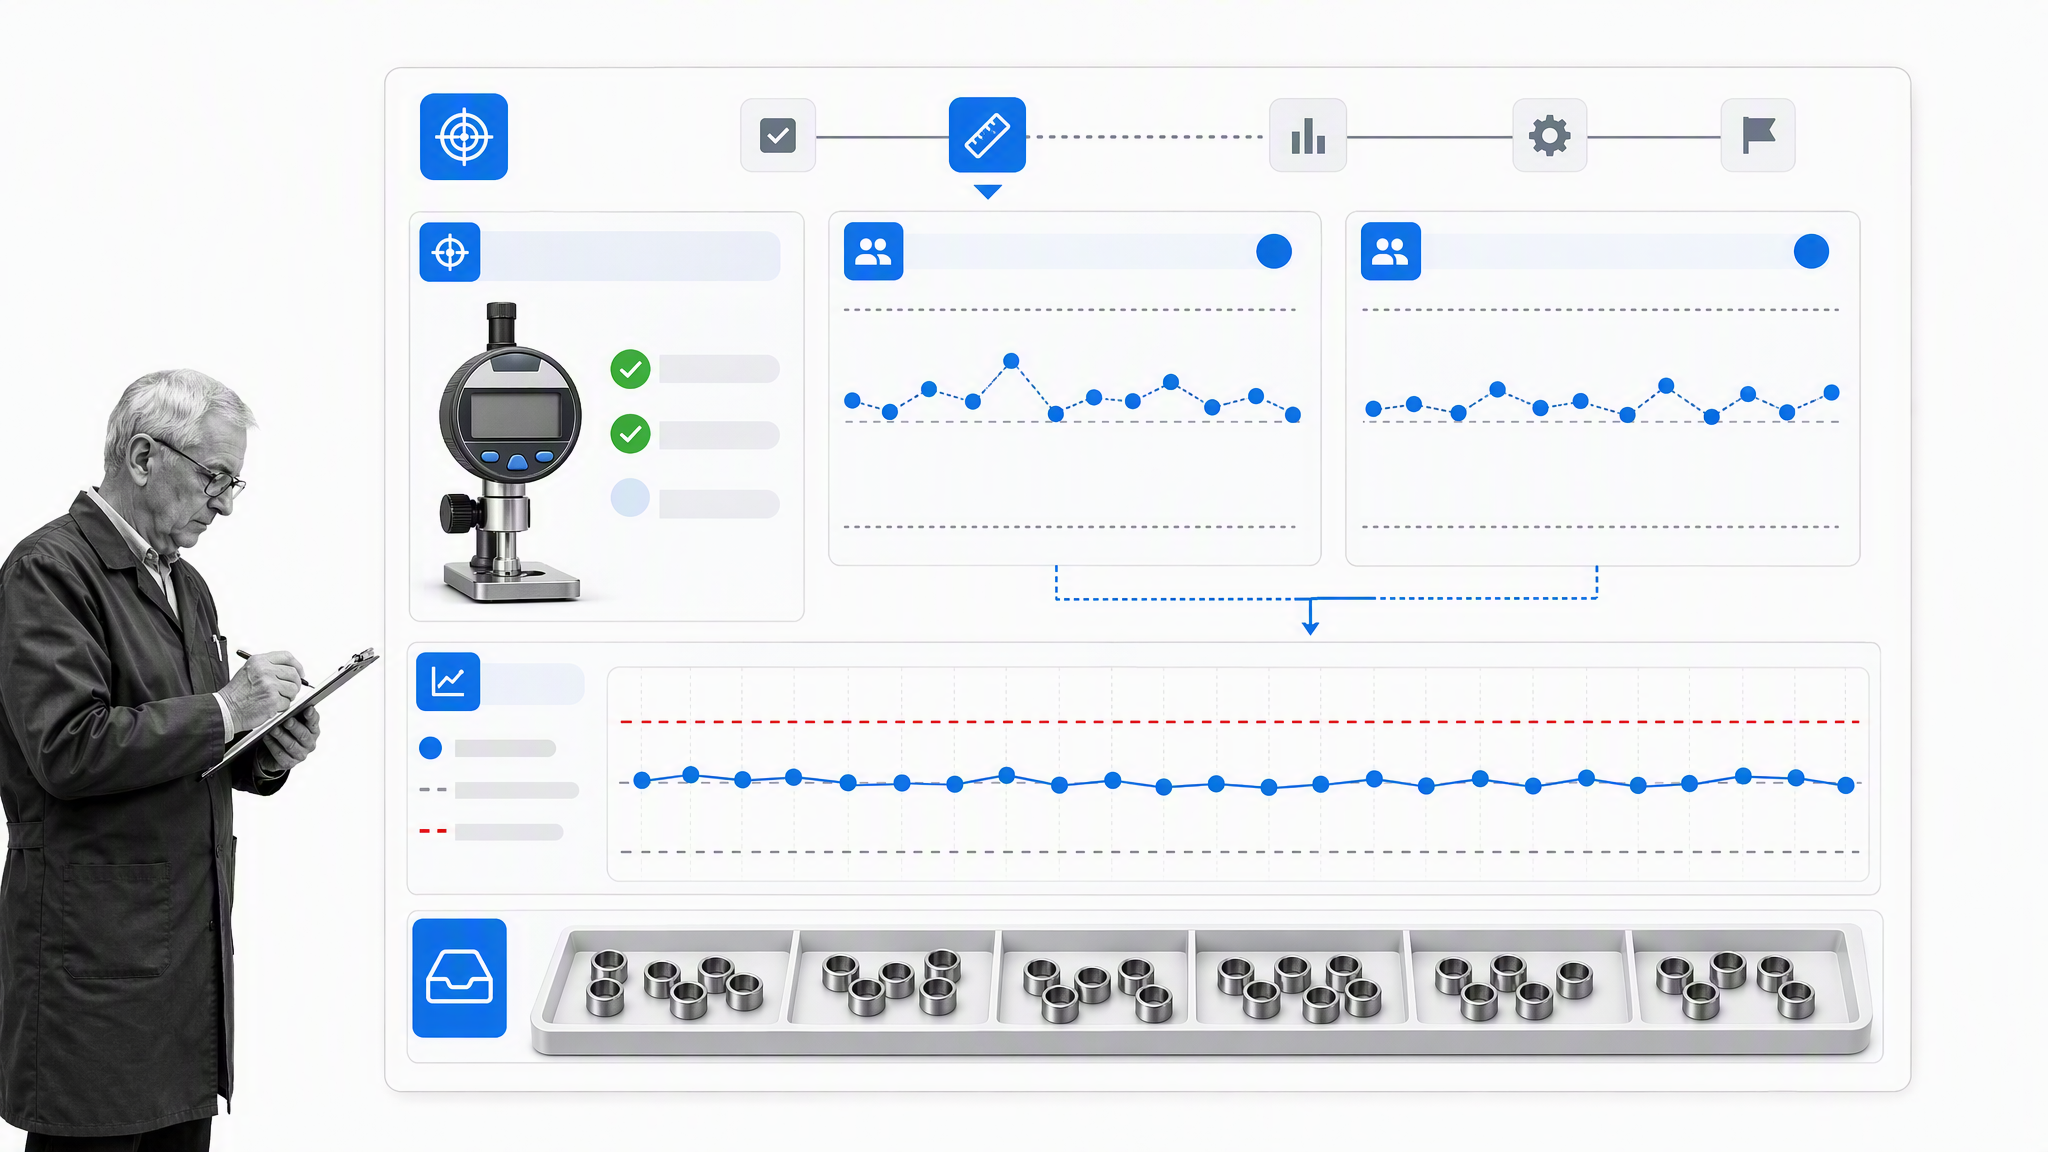
Well done, you have a research methodology! But don’t get too excited – we’re not quite ready yet. Like any piece of research, it is vital to test the methodology – or measurement system – before releasing it into the wild. As a researcher might conduct a pilot study, so too must we test our research methods and review them on a couple of key areas. There are 4 specific things we want to test before we launch our data gathering project in full:- Repeatability: If the same operator reaches pretty much the same outcome multiple times on the same item with the same equipment, we can see an adequate level of repeatability.
- Reproducibility: This becomes reproducible if multiple operators measuring the same items with the same equipment end up with the same outcomes.
- Accuracy: It’s a little trickier to be certain on accuracy, but we can broadly say that this can be seen in the difference between an observed average measurement and the associated known standard value.
- Stability: The level of stability is, in a sense, a further extension of repeatability and reproducibility. Stability can be seen by what extent the same operator gets the same outcomes from measuring the same item with the same equipment over a longer period of time. One of the things this stability check is looking for is whether there are external variables which can impact reproducibility over time.
Collect the Data
Not too much needs to be written about the actual data collection as all the previous steps have been building up to this point. The key thing to remember is simply to stick to your plan as you defined it and to adhere stringently to the research practices and methods which you validated. The Black Belt should be the primary point of command in this data collection process, making sure that all procedures are adhered to. The Black Belt needs to take responsibility for all the Green Belts understanding the necessary steps, definitions, and goals. To use a sporting analogy, the players are Green Belts, the captain is the Black Belt, the Process Owner is the head coach, and the Champion is the club chairman. Right now, it’s game day and on the pitch the captain needs to lead by example.Begin Developing Y=f(x) Relationship
This is where things will start to sound a little technical. But don’t worry, we’ll walk through it. Think of Y as representing the output of a process. It doesn’t technically refer to Yield at this point, but we’ll come to that later on. So, Y is the output of a process and X is the input. The f represents the function of the variable X. Y is the output we care about and X can be multiple different variables which impact on Y. Here’s an example from iSixSigma:For example, if you call your major department store to ask a question, the ability to have your question answered (Y) is a function (f) of the wait time, the number of people answering the phones, the time it takes to talk with the representative, the representative’s knowledge, etc. All of these X’s can be defined, measured and improved.At this point, you don’t need to work out the Y=f(x) relationship in full, but you can start bearing it in mind. It is considered best practice to keep work oriented around the Y=f(x) formula.
Estimate the Sigma Baseline
Again, we can prepare ourselves for the future stages by running a quick calculation. To work out your Sigma, you can calculate your Defects per Million Opportunities (DPMO) and run it through a handy conversion chart. You calculate your DPMO by simply multiplying your DPO by a million. To make it all easier, just use this straightforward Sigma Calculator. You can see an example calculation in the image below. Interpret the result using the calculator’s assumptions and the process context. Conventional Six Sigma DPMO conversions commonly apply a 1.5-sigma shift, so state that assumption whenever you report the result.Analyze: Understand where the problems in your process lie

Define Performance Objectives
Having measured the process in the previous steps, we should be in a position where we roughly know what it is we want to improve. Before we begin analyzing in depth, we should lay out what our objectives are so that these goals can guide us. Think through the process and the data you have to calculate what the key performance objectives would be. These objectives can prove slightly flexible as your analysis moves forward but it is always better to start with clear goals.Develop a Detailed Business Process Map
We’ve already mentioned in this article how you can use strategies like BPMN to map business processes, but it isn’t the only approach. A very similar approach might be to use an As Is Process Map, which can incorporate BPMN elements but is not defined by it. This business process map can help show us the granular make up of the company process we are analyzing and reveal factors like which process steps are value added and which are non-value added. Identifying non-value added steps at this stage opens up the potential for us to eliminate waste in our process improvements. This process map should be analyzed for potential areas of variation. These variations, or potentials for variation, will likely lead us to the root causes behind our Opportunities (for defects). An example Six Sigma As Is Process Map from Six Sigma Institute is shown below.Determine Root Cause(s)
There are many different techniques you can utilize in order to attempt to dig down into what the root causes of a variation are, and we’re going to look at three specific examples of methods you can use:- The 5 Whys Analysis
- The Fishbone Diagram
- The Pareto Chart
The vehicle will not start. (the problem)The Fishbone Diagram This approach takes 6 different variable categories and feeds the information together to help you visualize what factors within the business operations are contributing collectively to the same problem. One of the advantages of this method is that it forces us to view the problem holistically, rather than the potentially blinkered approach of the 5 Whys. According to the Six Sigma Institute, the 6 key variables are:
- Why? – The battery is dead. (First why)
- Why? – The alternator is not functioning. (Second why)
- Why? – The alternator belt has broken. (Third why)
- Why? – The alternator belt was well beyond its useful service life and not replaced. (Fourth why)
- Why? – The vehicle was not maintained according to the recommended service schedule. (Fifth why, a root cause)
Machine: This category groups root causes related to tools used to execute the process. Material: This category groups root causes related to information and forms needed to execute the process. Nature: This category groups root causes related to our work environment, market conditions, and regulatory issues. Measure: This category groups root causes related to the process measurement. Method: This category groups root causes related to procedures, hand-offs, input-output issues. People: This category groups root causes related people and organizations.They’ve also produced this neat little graphic of a company using the Fishbone Diagram to understand what factors contribute to a hypothetical company’s High Turn Around Time. The Pareto Chart You might already be familiar with the Pareto Chart. The purpose of the Pareto approach for us is to understand which variations have the highest impact on our output; it helps us determine the Vital Few. If the other techniques assist in finding variations and identifying potential root causes, the Pareto Chart allows us to prioritize which root causes to target first to have the greatest impact on improvement in relation to our stated objectives. Here’s the Six Sigma Institute’s example Pareto Chart.
Determine the Y=f(x) Relationship
Once we’ve identified the Vital Few, we’re able to return to our Y=f(x) formula. Remember, Y is simply a variable which is defined by the relationship between our Xs and their functions. So, if we want to improve Y then we should identify which X has the biggest impact on the Y value and improve that X. Our ultimate aim is to better understand the relationship represented by this formula and to round out errors from it. For example, there may be an X which has a major impact on Y but is not due to a process problem but simply a natural or unchangeable element of the manufacturing process. In which case, we need to identify that this particular X, while important, is not one we can tackle as part of our process improvement. Our job isn’t just to find the Xs which contribute to Y, but to find the right Xs. This image from iSixSigma helps to illustrate how that process runs through the heart of our investigation.Improve: Work out how defects could be reduced
Perform Design of Experiments
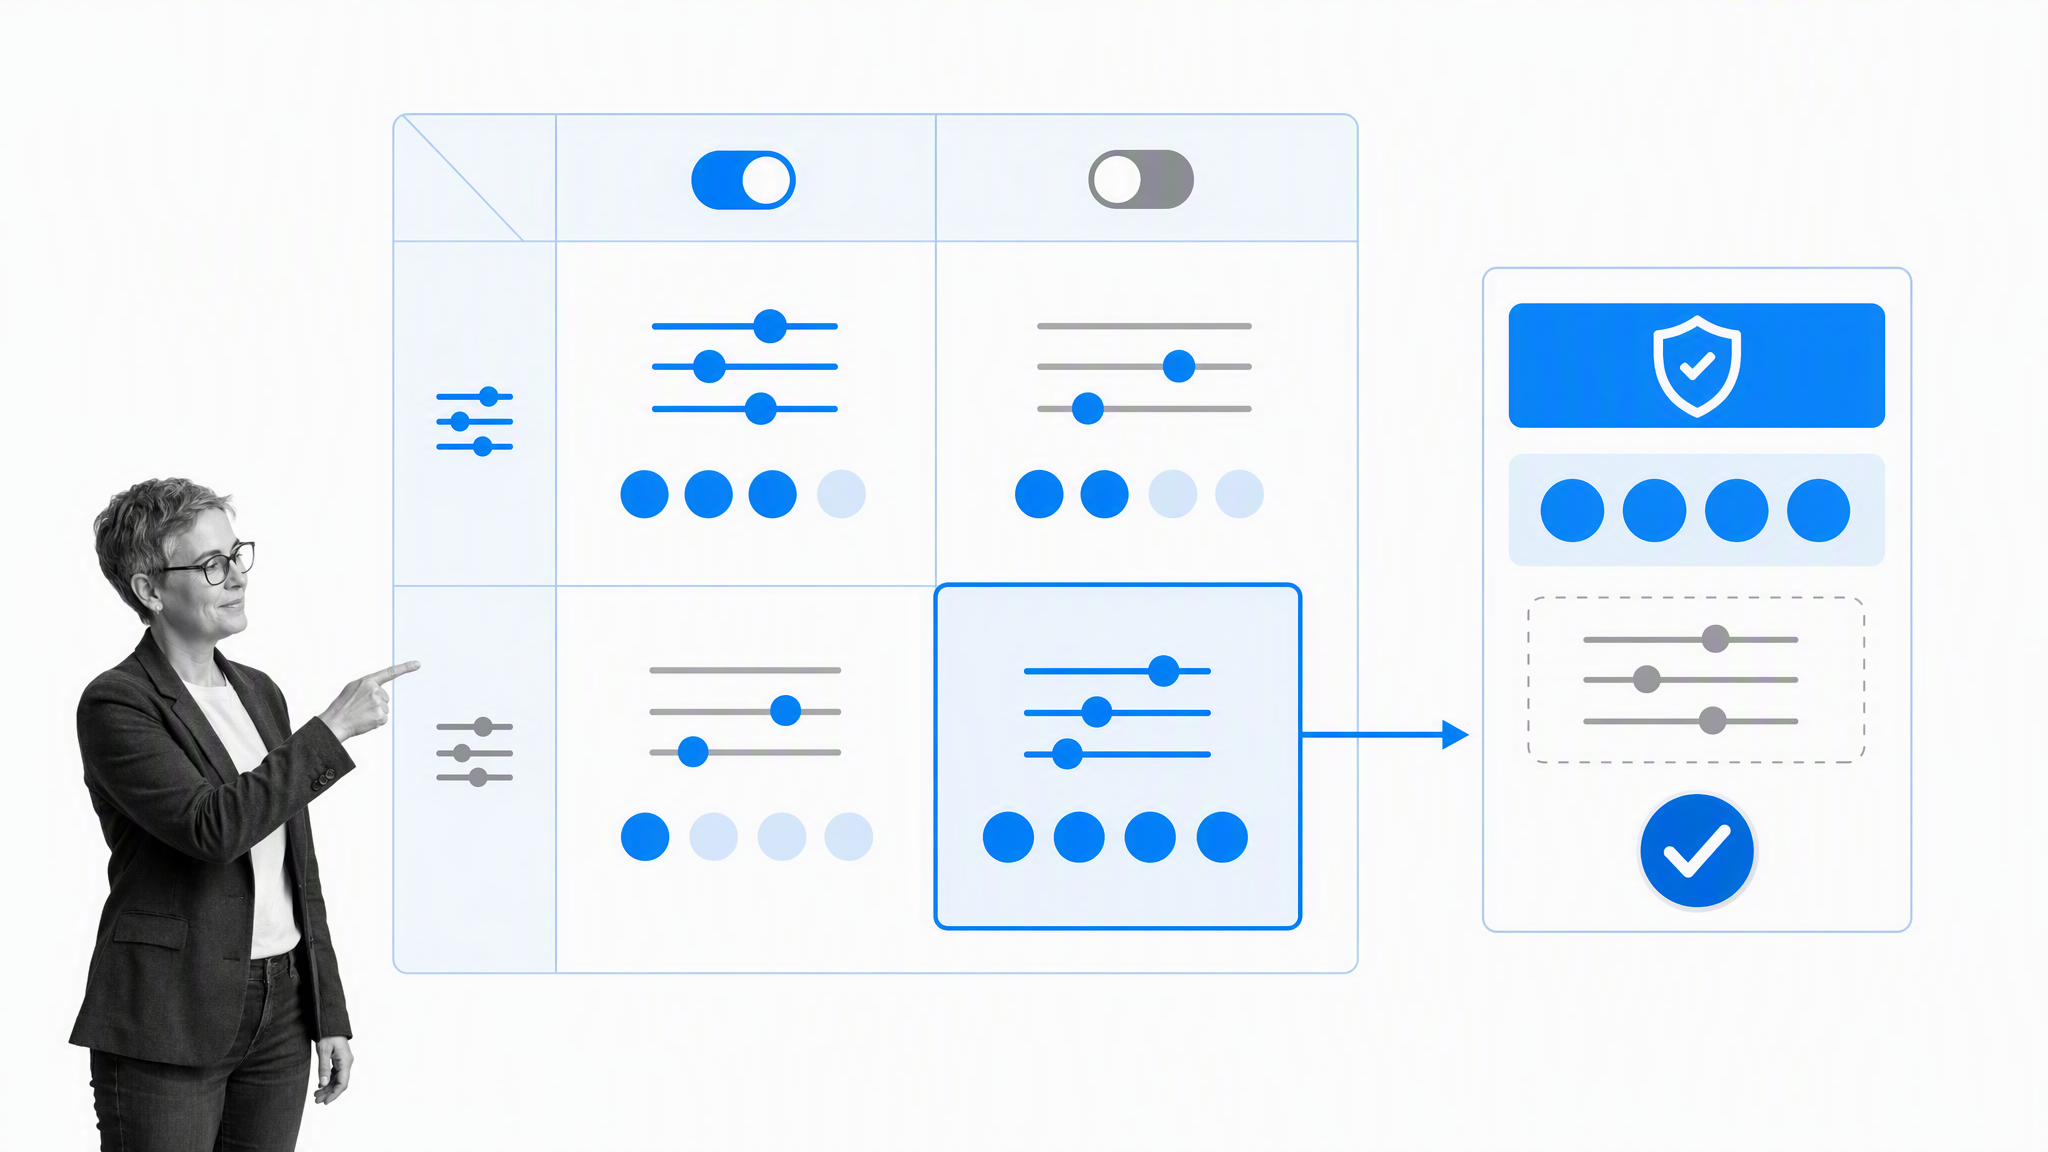
A Design of Experiments, or DOE, changes selected factors in a planned way so you can estimate their individual and combined effects on a response. Factorial designs are especially useful because they test combinations of factor levels instead of changing one variable at a time. The iSixSigma DOE primer uses a cake-baking example that makes the logic tangible. Start by separating the variables:- Controllable input factors: X variables you can deliberately change, such as flour brand, oven temperature, or baking time.
- Uncontrollable or noise factors: conditions you cannot easily hold fixed, such as ambient humidity. You can sometimes block on these factors or randomize run order to reduce bias.
- Responses: measurable outcomes that represent customer needs, such as a blinded taste score or crust weight.
H0: mu = 30 versus Ha: mu is not equal to 30Blocking groups comparable runs around a nuisance source of variation. Replication repeats factor combinations so experimental error can be estimated. Randomization protects the result from time order and other hidden patterns. An interaction occurs when the effect of one factor changes depending on the level of another. For example, extra baking time may improve taste at a lower temperature but harm it at a higher temperature.
Two-Level Factorial Design
In a two-level full factorial design, each factor is tested at a low and high setting. Three factors produce eight combinations. For the cake example, the factors might be flour brand, baking temperature, and baking time. The responses could be a standardized taste score and crust weight. Run every combination in a randomized order, replicate where practical, and record the response using the same measurement method. An analysis of variance can then test whether differences among factor levels and interactions are statistically significant. The F ratio compares variation attributed to a modeled effect with residual variation. Interpret it with its degrees of freedom and p-value, not as a standalone importance score. NIST also provides a reference for two-level full factorial designs. The result might show that time, temperature, and their interaction drive taste while none of the chosen factors materially affects crust weight. That is useful evidence, including the negative result. It suggests that the crust response needs a different factor, such as egg quantity, mixing method, or moisture, rather than an unsupported conclusion.Develop Potential Solutions
Translate the verified factor effects into several candidate solutions. Each option should trace back to an analyzed cause and specify the operating change, expected effect, owner, cost, dependencies, and measurement plan. The goal is a testable set of choices, not a long brainstorm. For additional ways to structure experiments and improvement work, see these Lean Six Sigma tools. Screen options against the target metric and customer requirement before spending time on detailed implementation.Assess Failure Modes of Potential Solutions
Failure Modes and Effects Analysis identifies how a proposed change could fail, estimates the consequence and likelihood, and prioritizes preventive or detection controls. Run FMEA before broad implementation so the team can change the design while the cost of change is still low. The Process Street guide to Failure Modes and Effects Analysis explains the method in more detail. The public template below provides a practical structure. A template supports the analysis, but it does not replace technical judgment or guarantee that every failure mode has been found.Validate Potential Improvement by Pilot Studies
Pilot the strongest candidates in controlled operating conditions. Define the population, sample size, start and stop rules, safety constraints, data collection method, and rollback plan before the pilot begins. The Process Owner can design governance while the Black Belt or project lead manages execution. Compare pilot results with the Measure-stage baseline. Select a solution using its effect on the target metric, implementation risk, cost, operational fit, and strength of evidence. Recalculate relevant capability or sigma metrics using the same definitions and measurement system. A small win that survives a controlled pilot is more valuable than a large claimed effect that cannot be repeated. Before moving to Control, confirm that the improvement works across the conditions the normal process will face. Check different shifts, locations, customer types, volume levels, and operators where they could affect the result. Look for unintended consequences in safety, compliance, cycle time, cost, and downstream work. If the pilot improves the headline metric by pushing defects elsewhere, it has not solved the system problem. Record the chosen settings and the evidence for rejecting other candidates so later teams do not repeat the same experiments without learning from them.Control: Plan out how you will implement your solutions
Standardize and Document Processes
Document the approved method as an actionable procedure. Include the purpose, scope, responsibilities, required evidence, decision rules, exceptions, and change history. Standardization does not mean ignoring context. It means that intentional variation is governed and unexplained variation is visible. Process Street is one Compliance Operations Platform with Docs and Ops capability areas plus built-in AI. Docs supports governed policies and procedures. Ops turns them into workflows with ownership, approvals, evidence, audit trails, and performance visibility. Built-in AI can assist with drafting, knowledge retrieval, and routine work inside those controls. Teams can use that structure to connect a documented control plan with the work that executes it. The ISO-oriented template below is a starting structure for a quality manual. Using a template or platform does not itself confer ISO certification.Prepare Implementation Plan
Plan the transition from pilot to normal operation. The Process Owner and project lead should answer:- Which teams, systems, suppliers, or customers are affected?
- Will rollout be simultaneous or phased?
- Who trains and supports each team?
- Which resources must the Champion or sponsor secure?
- When does implementation begin, and what proves it is complete?
- Who approves changes to the controlled method?
Implement Statistical Process Control
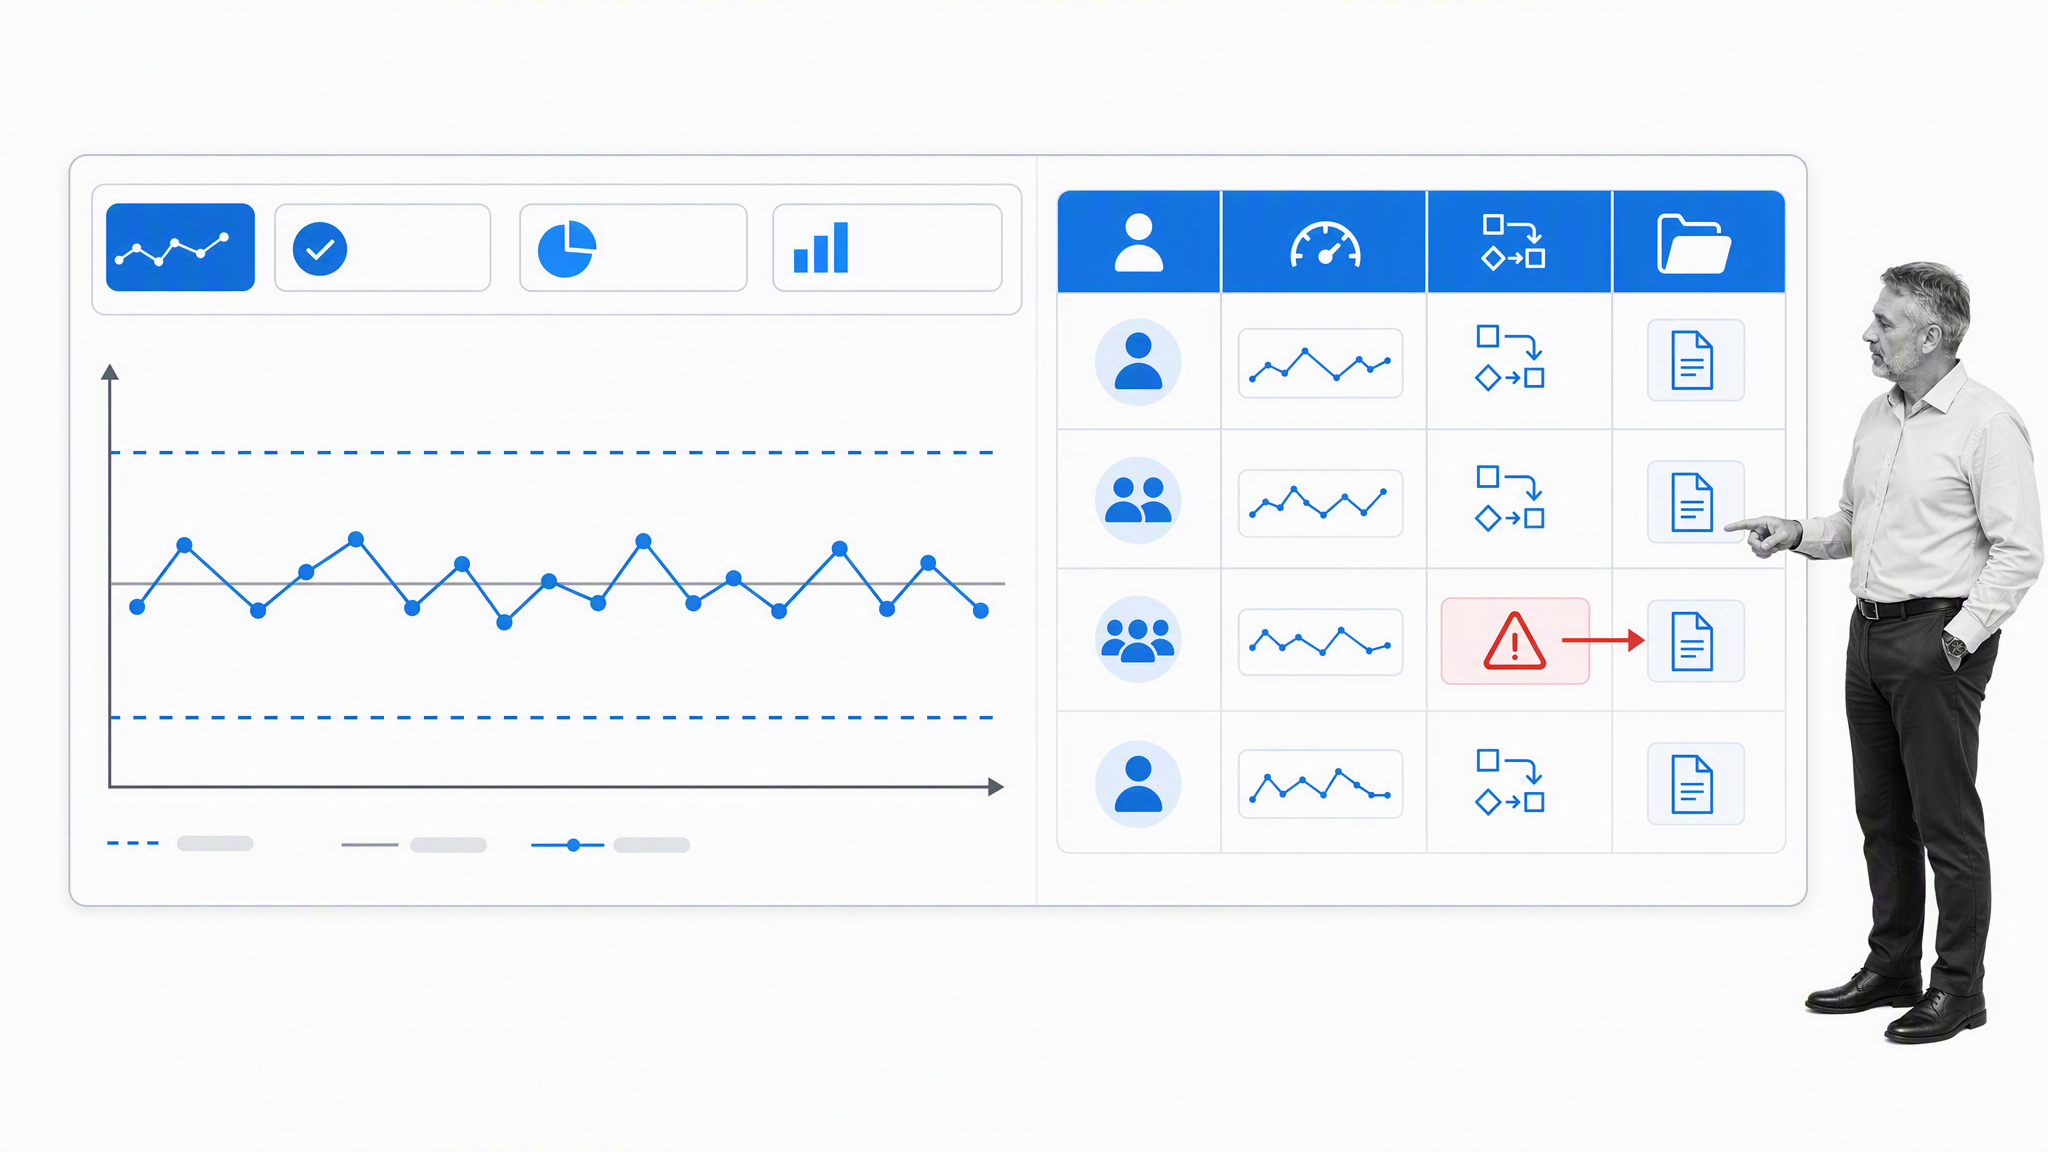
Statistical process control uses time-ordered data and control charts to distinguish common-cause variation from signals that the process may have changed. Walter Shewhart introduced the control chart in 1924. The ASQ control chart guide explains its construction and interpretation. Control limits are calculated from process behavior. Specification limits come from customer, engineering, regulatory, or business requirements. A process can be statistically stable and still fail specifications, or meet specifications temporarily while remaining unstable. Do not treat the two sets of limits as interchangeable. When a point or pattern signals special-cause variation, follow the response plan: contain the risk, verify the measurement, investigate the cause, correct it, and document the evidence. Review the control plan at a defined cadence and whenever inputs, equipment, people, suppliers, or requirements change. Ownership is the difference between a chart that gets watched and a control system that works. Name the person who reviews each measure, the person authorized to stop or contain the process, and the person who approves a permanent change. Define how missed checks are escalated and where evidence is stored. Train operators on the reason for the limits as well as the mechanics of recording data, because people are more likely to spot weak signals when they understand what the measure protects. Control also includes a handoff back to improvement. Stable data can reveal a new constraint, a changed customer requirement, or an opportunity that was outside the original scope. When that happens, write a new problem statement and decide whether another DMAIC cycle is justified. Do not quietly alter the controlled process and erase the baseline that made the new evidence visible.Use DMAIC to help you reach your Six Sigma goals
The post DMAIC: The Complete Guide to Lean Six Sigma in 5 Key Steps first appeared on Process Street | Compliance Operations Platform.






0 Commentaires