
Burkhard Berger, founder of Novum, contributed this guide based on lessons from building and scaling digital businesses. A swim lane diagram is a process map that divides work into parallel lanes, with each lane assigned to the person, team, department, or system responsible for that step.
That structure makes cross-functional ownership and handoffs visible at a glance. This step-by-step process mapping guide explains where swim lanes came from, when they help, where they fall short, and how to create an effective swim lane diagram in desktop Microsoft Word.
You can read from the beginning or jump straight to the section you need:
- Swim lane diagram: An origin story
- Sink or swim: The pros and cons
- 5 questions to make sure you’re swim-ready
- How to create a swim lane diagram in Microsoft Word
Let’s dive in.
Swim lane diagram: An origin story
Swim lane diagrams are versatile charts that allow you to easily visualize each step of a process, as well as who is involved and which steps they’re responsible for. They’ve been used to document processes from project management to student tutorials. The biggest benefit is that, by mapping processes across the different “lanes,” it becomes very simple to break down complex processes to keep a client informed, help managers identify broken processes, and train employees in new skills.
A documented predecessor appears in a 1945 US Bureau of the Budget bulletin as a multicolumn process chart for work involving multiple organizational units. The format established the same core idea used today: separate responsibility areas, then show how work moves between them.
Geary A. Rummler and Alan P. Brache helped popularize the format in their 1990 book, Improving Performance: How to Manage the White Space on the Organization Chart. That is why swim lanes are also called Rummler-Brache diagrams, although the pool metaphor is easier to remember.
Swim lanes are now used across informal flowcharts and standardized notations. In BPMN, for example, pools and lanes organize participants and responsibilities. Microsoft Visio also provides a current cross-functional flowchart template with swimlane shapes.

The most common swim lane symbols represent a start or end, a process step, a decision, and a document. More complex processes can use additional flowchart symbols, but a small, consistent set is easier for readers to follow.
Informal flowcharts can vary, so include a legend whenever a symbol might be unfamiliar. Consistency matters more than showing every possible notation.
The diagrams themselves are made up of parallel lines, either horizontal or vertical, with each lane representing an actor or entity (such as department, team, employee, etc.) who has a role within the process. Swim lanes use standard flowchart symbols to represent different events within the process, such as when a decision should be made or a specific action should be taken.
Before we get into the nitty-gritty of building your own diagram, let me walk you through what a completed diagram will look like. For this diagram, I’ve used a very simplified help ticket process (and a very talented graphic designer) to illustrate the basic foundations of a swim lane diagram.
To start with, we have 4 key players:
- The customer
- The customer success representative
- Tech support
- The developer(s)
If you look at the diagram below, you can see that each one is given their own lane, starting with the customer at the top since they will be the one to kick off the process. This diagram is laid out horizontally for the simple fact that it fits better on a standard computer screen. If you prefer a vertical diagram, by all means, create yours vertically. Ideally, with a completed swim lane diagram, it shouldn’t make much difference which orientation you use. Even the example I have here could be understood if flipped vertically, as is. It might not be as clear, but you could figure out the process if you had to.
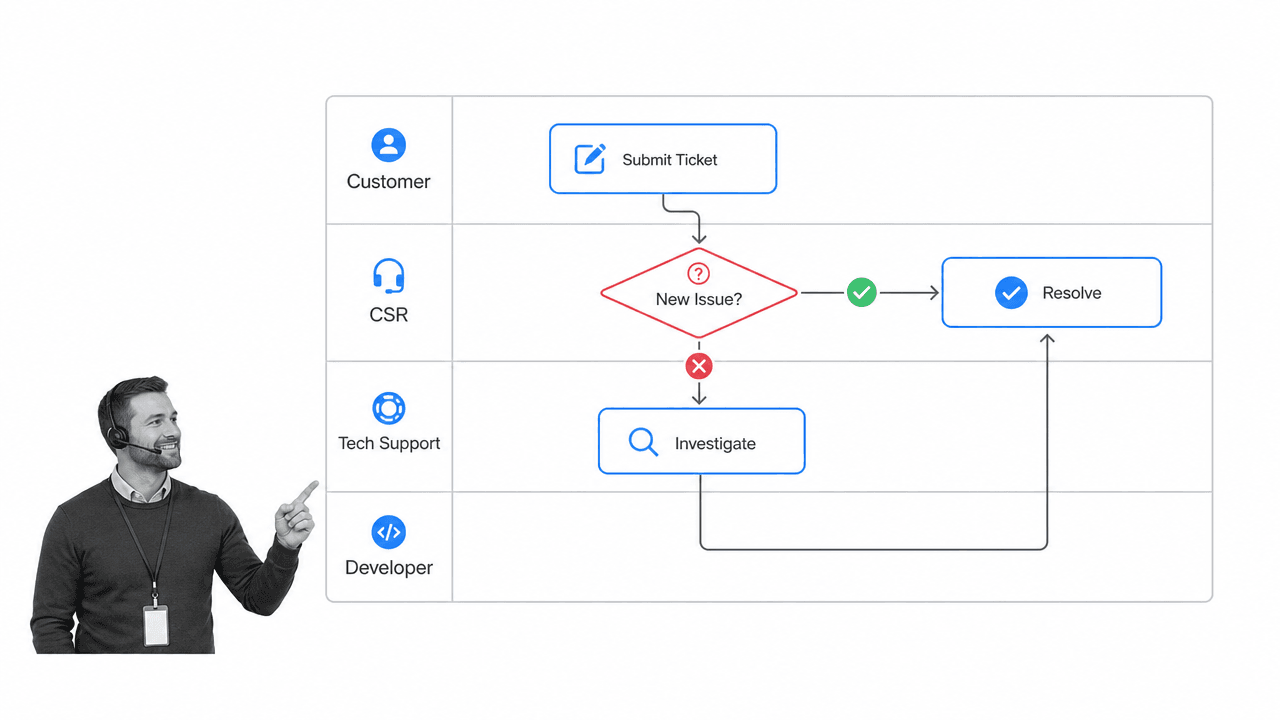
Each individual or department has a lane, and the tasks they own stay inside that lane.
For example, the CSR’s tasks are:
- Determine if the ticket is a new issue
- Get more information from the customer if needed by tech support
- Confirm that the issue has been resolved
- Respond to the customer with the result
Let’s imagine that this is only our CSR’s second day. They handled a few simple tickets the previous day while shadowing a colleague, but this is the first ticket they’re handling on their own. To help them remember the process, this swim lane diagram is posted in their work area.
A ticket comes in. The CSR consults the diagram and sees that their first task is a decision: Is this ticket a new issue?
Based on the knowledge library, the CSR determines it’s not a new issue. That branch skips over their second (potential) task, to the third: Resolve. The CSR corrects the problem, notifies the customer, and the help ticket process is completed.
In this scenario, the swim lane diagram has:
- Increased efficiency by freeing up experienced CSRs to handle more complex problems
- Reinforced the new CSRs training with a visual aid
- Given the new CSR reassurance and confidence in interacting with the customer
- Ensured the customer’s issue was taken care of through an established process
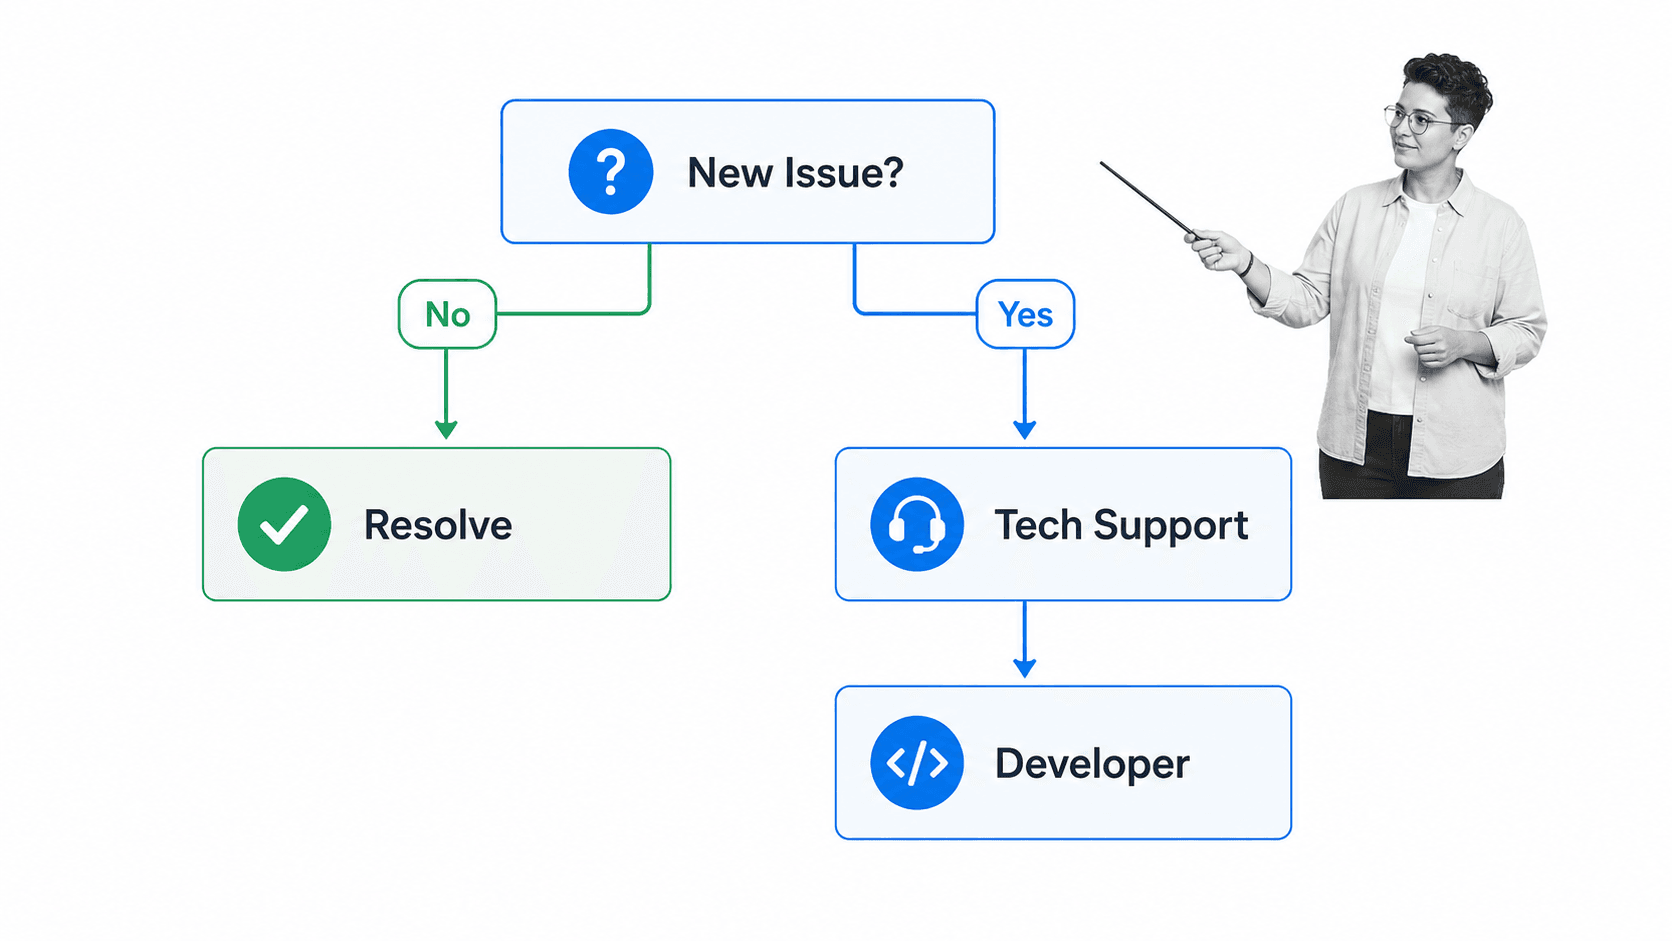
Maybe the next ticket that comes in is a new issue and has to be passed on to tech support.
The CSR then gets a request to get more information from the customer, but the customer now has questions. Why does the CSR need to know these specific details? How will this information help solve their problem? What is actually being done to solve their issue?
By using the diagram, the CSR can trace the corresponding arrows to see exactly what step each department will take, and in which order, throughout the process. The CSR can then explain that tech support is trying to recreate the issue so they can determine the best way to fix it. If tech support can’t find a solution, they’ll pass it on to a development team to do a more thorough analysis to figure out the problem.
Admittedly, processing a help ticket isn’t very complex, and most organizations generally follow fairly similar steps to do so. That said, this example should give you an idea of what a swim lane diagram looks like and how it might be used for daily tasks.
Sink or swim: The pros and cons
Surprising as it may be, even swim lane diagrams are a little controversial. Some people swear by them; others insist they’re a waste of time. The truth most likely lies somewhere in between, but for the sake of laying all cards out on the table, let’s discuss some of the pros and cons of using swim lane diagrams for your process mapping.
Benefit, clearer stakeholder communication
Swim lane diagrams make it easier for executives and other colleagues to understand the process. They can assess an individual’s obligations in relation to the responsibilities and sub-processes of other teams and departments.
Limitation, not enough operational detail
A swim lane diagram is a high-level responsibility view, not a complete procedure, control set, data model, or exception guide. As detail accumulates, one diagram becomes harder to scan. Keep the main view readable and move procedural detail into linked subprocesses or supporting documentation.
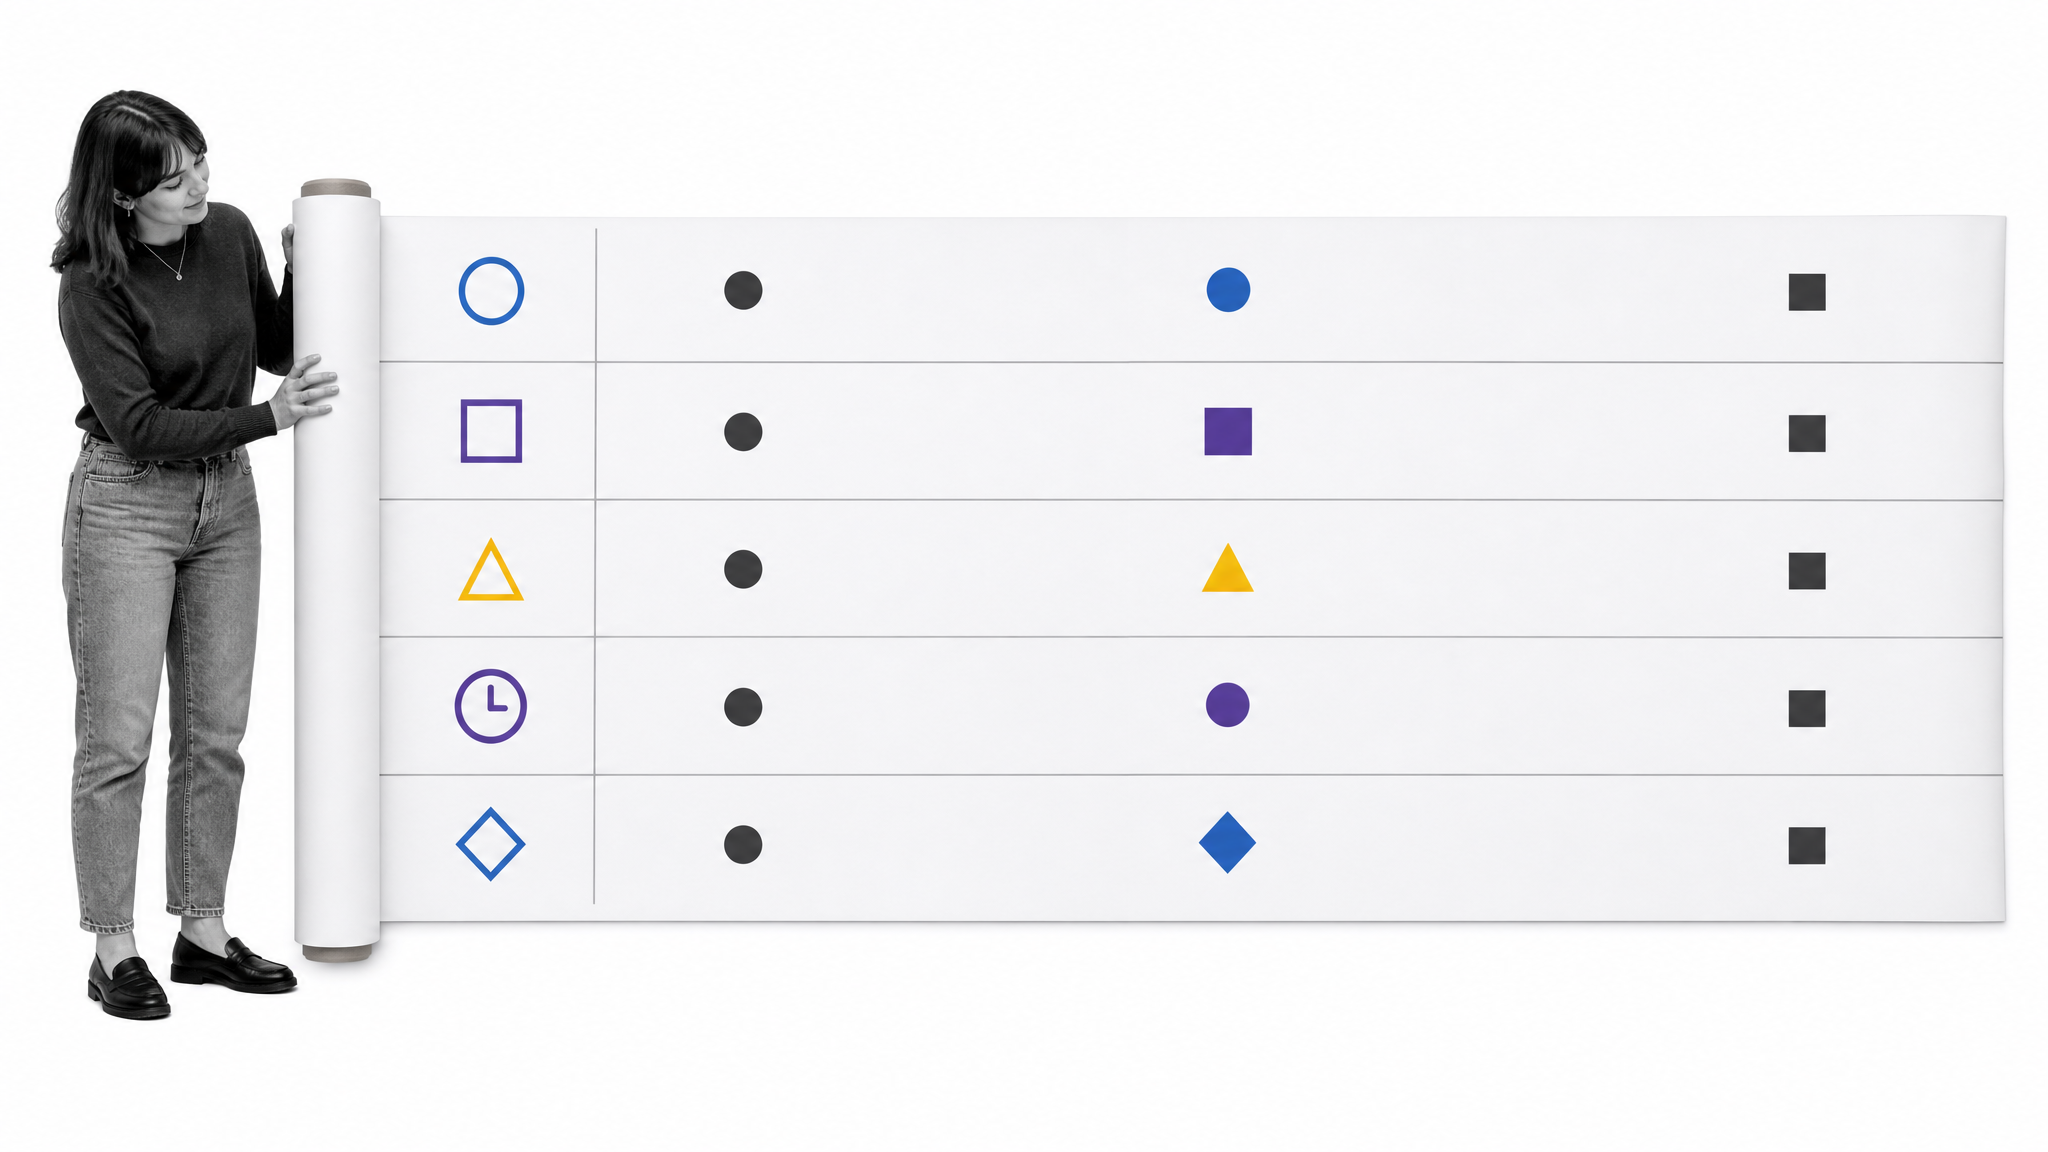
Note: Makigami is a process improvement and mapping method documented at Fujico in 1996. The name means “roll of paper,” which is a useful reminder that one person’s single page can be another person’s long process surface.
Benefit, a simpler view of complex work
Written, and especially spoken, process explanations can get complicated. If all parties involved don’t use the same terminology, or even the same language, confusion is bound to arise. In the end, the necessary information may not get conveyed at all.
With a swim lane diagram, the symbols make it clear at a glance what action is being taken and the arrows illustrate which direction the tasks move in. Each process is broken down to its bare bones, so there is no question about who performs what step, when, where, and why. The ability to incorporate if/then branches also eliminates the need to create a process map for every potential variation. Going back to our newly hired CSR, they don’t have to check one map for a new issue and a different map for an old one; both are dealt with in a single diagram.
Limitation, informal conventions can vary
BPMN has standardized pools and lanes, but informal flowcharts still mix notation conventions. If you collaborate across organizations, agree on the symbol set and add a small legend before sharing the diagram. It’s a bit like asking for chips in the UK or about football in the US: you may know what you mean, but another reader may interpret the same term differently.
5 questions to make sure you’re swim-ready
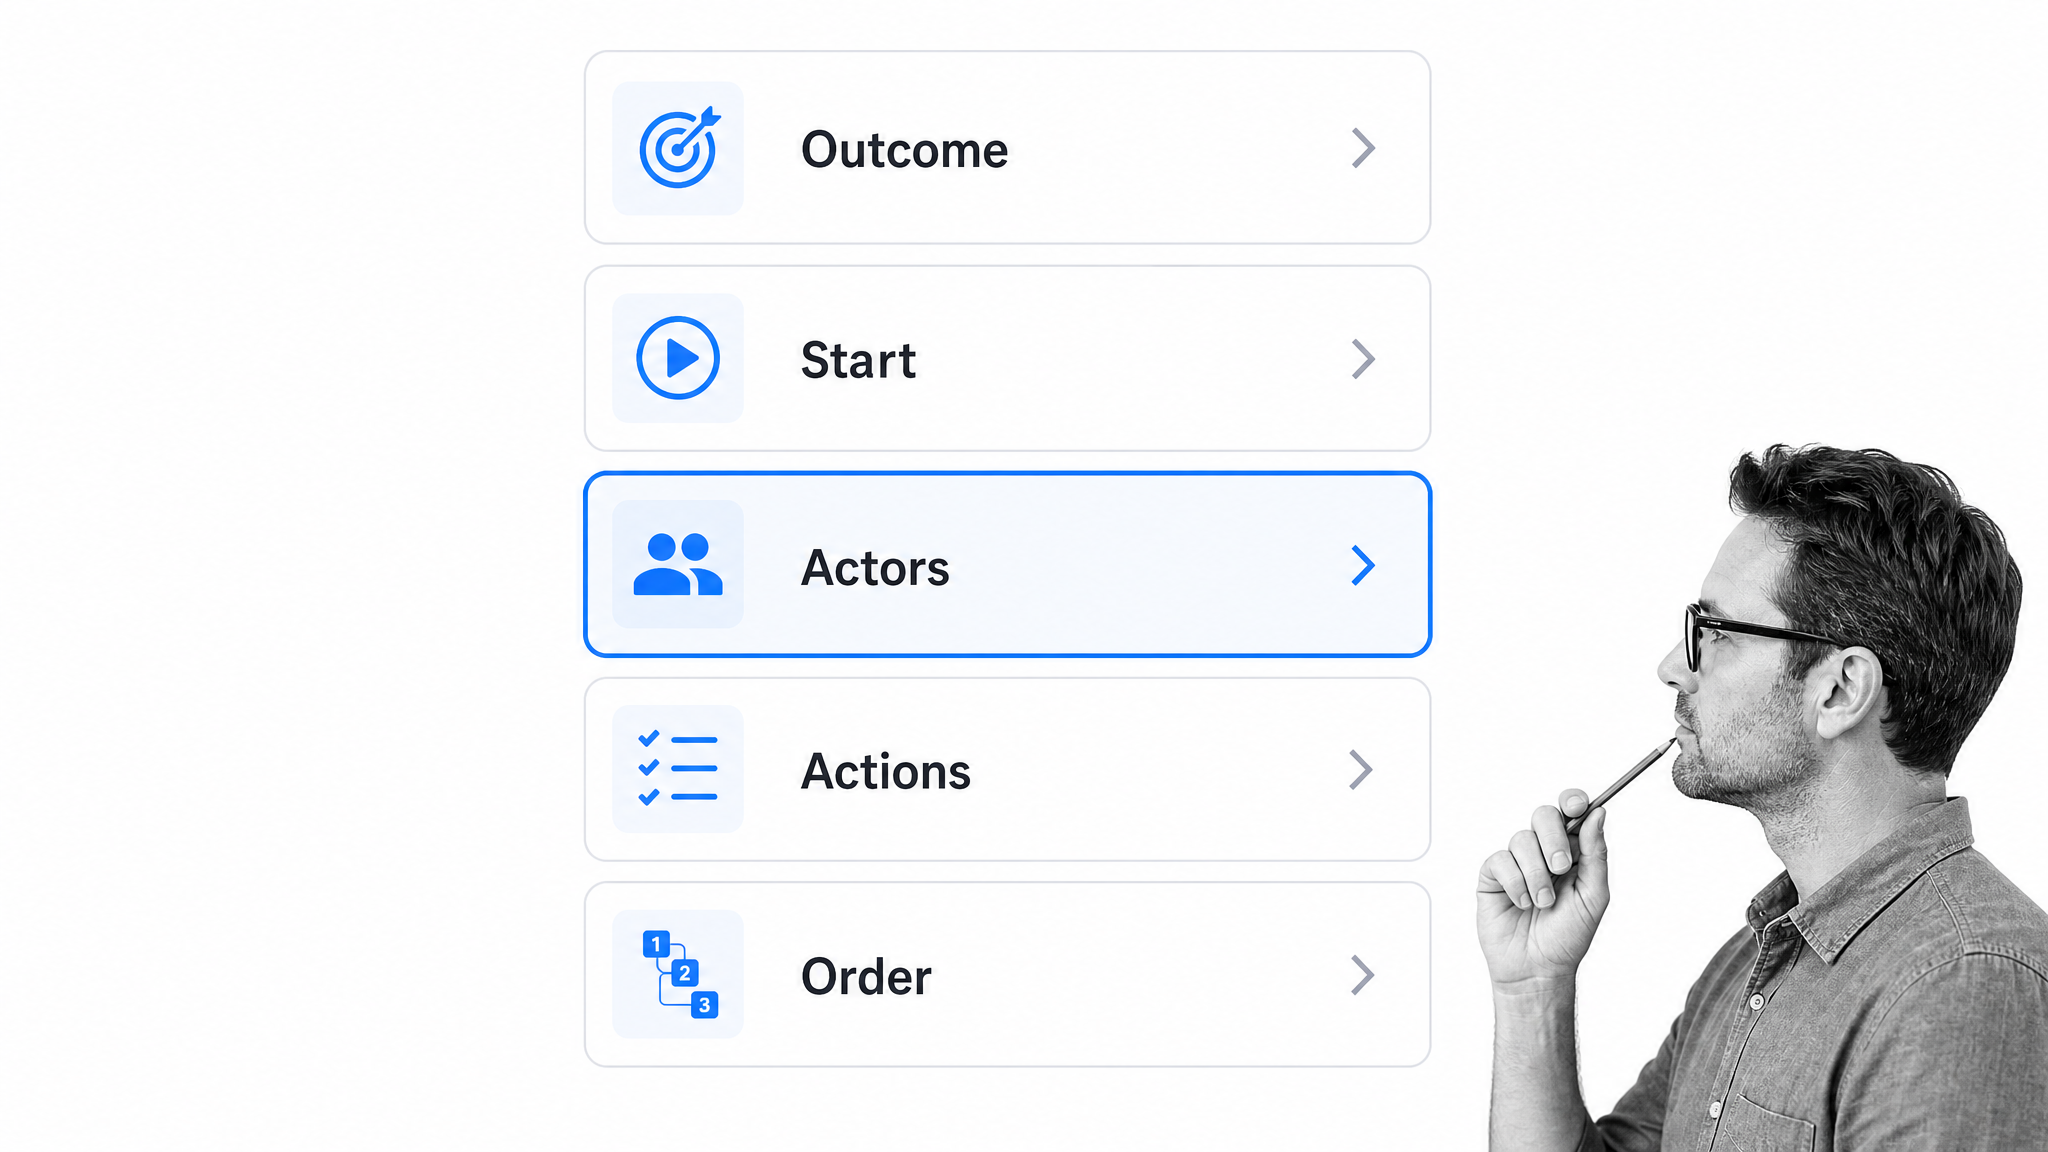
I can tell you’re eager to get started, but before we jump into the deep end, we need to cover a few safety questions first.
Answering these questions in advance will prepare you to create your swim lane diagram, and, to be perfectly honest, make the process a whole lot easier. Our focus here is optimizing company workflows, so I’ve phrased the questions to align with that. The concepts are pretty easy to translate across purposes, though, so don’t feel like you’re constrained to just what’s included in this post.
Define the outcome
Basic, first step question when starting any project, big or small: What do you want to achieve by doing this? What’s your endgame? It’s good practice in most situations to know where you expect to end up, but this is especially true for process mapping. If you aren’t sure where your process ends, you have a lot more to figure out than a diagram can tell you.
Choose the starting boundary
Obviously, all processes start somewhere, but where do they really start? Looking at the help ticket process, does it start with the customer submits a ticket or does it start when the CSR receives the ticket? Does it start before the customer even submits a ticket, maybe when they first encounter the problem. The customer could take to the internet and try solving the issue on their own using help docs, forums, and the good old-fashioned turn-it-off-and-turn-it-back-on-again or the smack-it-until-it-does-something technique. In that case, the process, for the customer, starts well before they submit that help ticket to the CSR.
Point being: decide where your process starts. What event initiates the process you want to map?
Identify the actors
When determining who will be included in your diagram, you need to make sure that everyone involved in completing a process is represented, even if that individual or department is only responsible for a single task.
Generally, when creating a swim lane diagram for cross-functional teams, it’s best to form a cross-functional working group that’s responsible for ensuring every part of the process is properly documented. This helps make sure that smaller steps aren’t forgotten or necessary groups left out.
Choose the right action detail
You may want to say, well, every action in the process. Maybe, maybe not.
In our help ticket diagram, should we say that the CSR’s actual first task is to read the ticket? The steps of their process may actually be:
- Receive the help ticket
- Confirm receipt with customer
- Determine if it’s an old or new issue
- If it’s a new issue, send on to tech support
- If it’s an old issue, resolve it themselves
- Update customer with next steps
Yes, that is a more detailed version of the specific actions the CSR has to take every time a help ticket is submitted, but is that specificity really useful in explaining to external stakeholders how the process works? You need to decide which actions are vital for inclusion and which aren’t; you will probably also discover, in the process, that some actions are being repeated unnecessarily, which will improve the process as you map it.
Order the path and exceptions
It’s usually best to map something out from start to finish, but not all circumstances allow for that. Diagrams for very complex or intricate processes may include loops, merging of tasks, different forms of input and output, and a host of other variables.
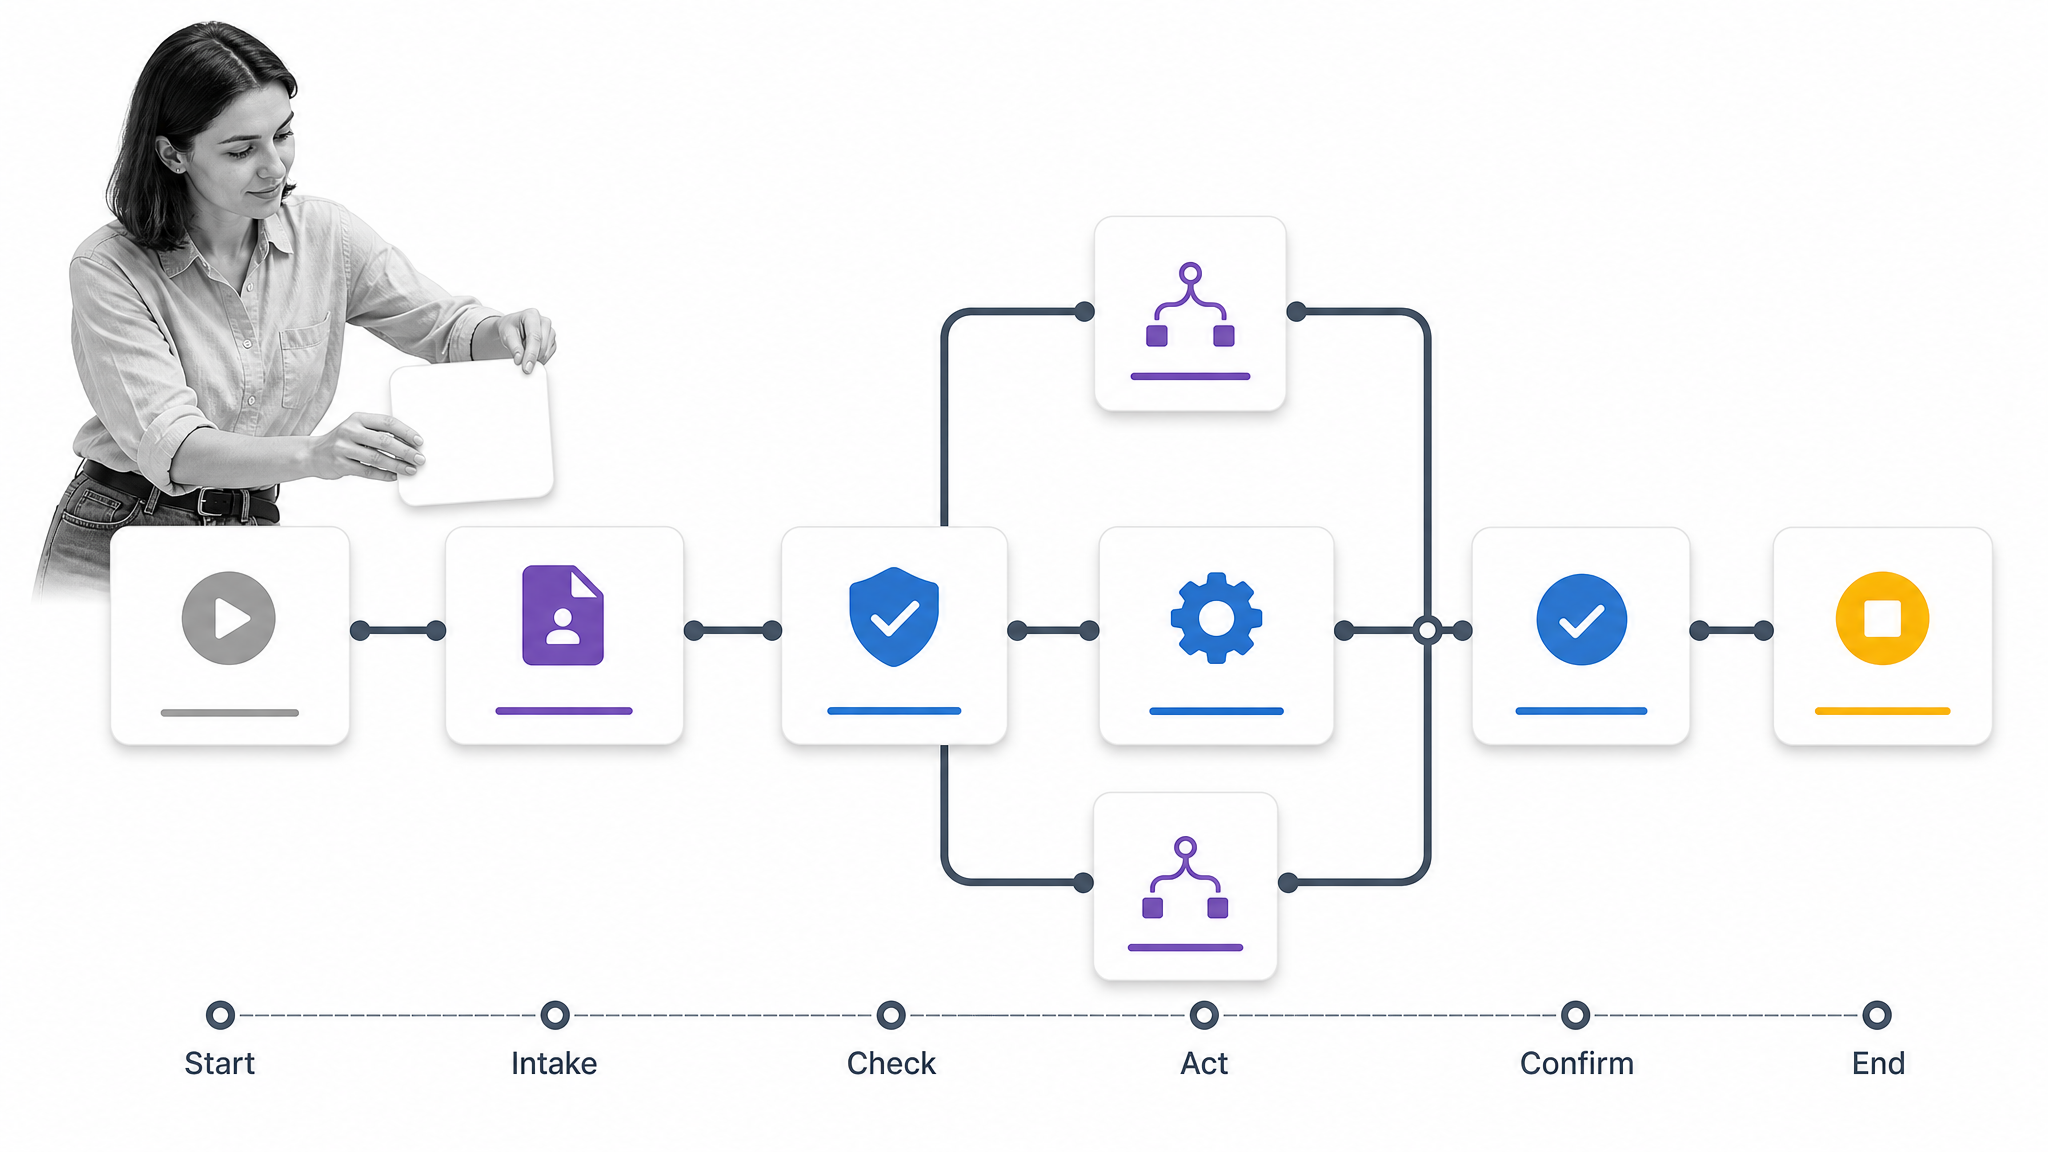
The easiest approach is to walk through your process from start to finish with the most common actions.
If everything runs smoothly and follows the typical steps, what order do they go in? Once you have that framework laid out, you can decide which process branches should be included and which aren’t as likely or important to consider during the mapping process.
And now the part you’ve all been waiting for:
How to create a swim lane diagram in Microsoft Word
These instructions apply to the desktop versions of Microsoft Word. Start with a new document. Word works well for a straightforward diagram, but complex handoffs, exceptions, and collaborative review may call for dedicated software for workflow diagrams. Microsoft also documents the current drawing and connector tools in Word.
Depending on whether you want your diagram to run horizontally or vertically, you may need to change the page orientation. I wanted to create a horizontal diagram, so I switched to a landscape view before starting. I’ve broken the process down into 5 easy steps, so even if you’re not familiar with Word, you should at least be able to make a swim lane diagram by the end of this post.
Step 1. Draw the pool
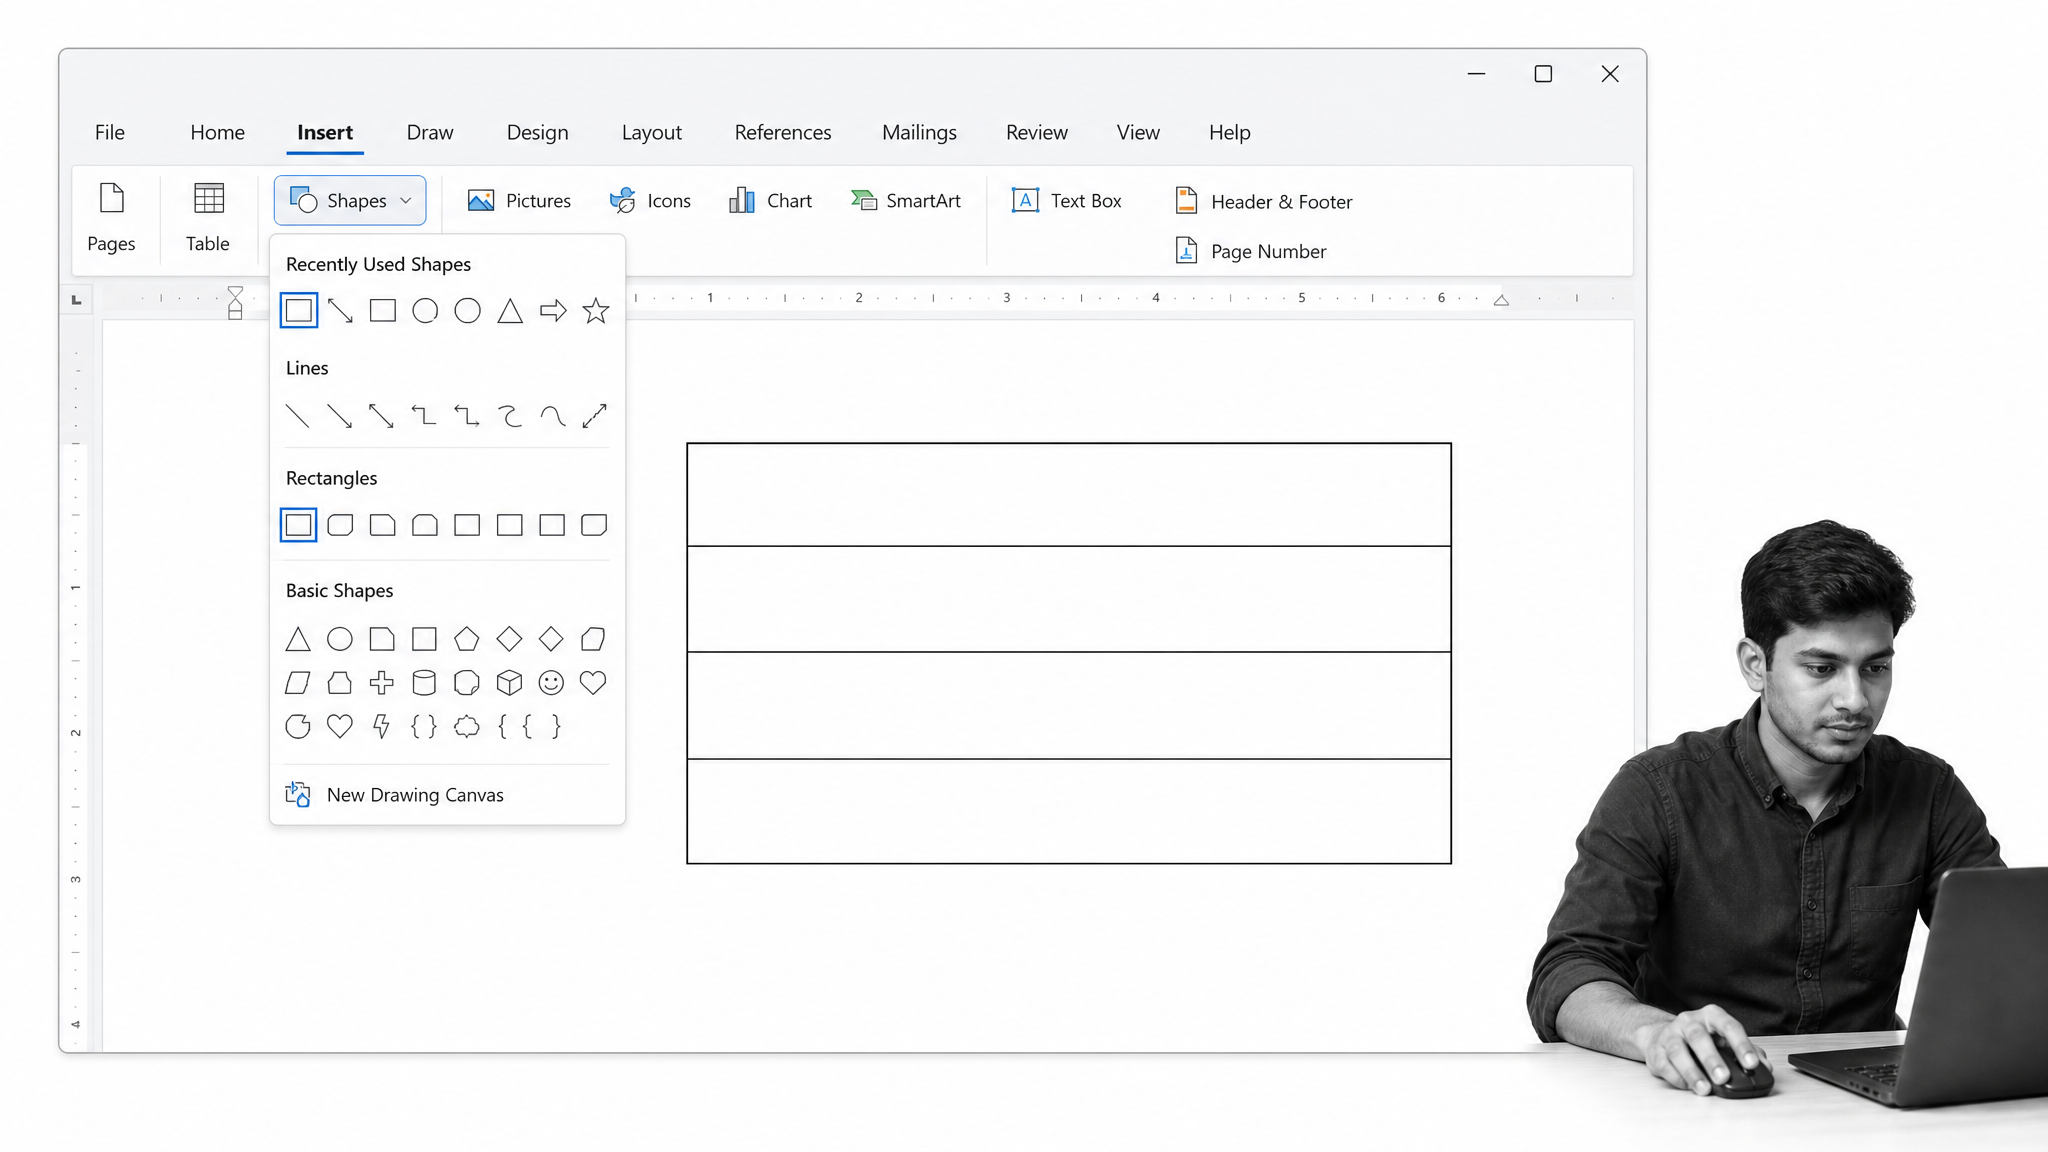
At the top of the screen, you’ll see a series of tabs labelled “File,” “Home,” “Insert,” and so on. Select the “Insert” tab.
Select “Shapes” (as shown in the image above), which will open a dropdown menu of every single shape you can create in Word. Right now, you just want a good old-fashioned rectangle.
Draw a large rectangle on the page. This will be your pool.
Pro tip: Make sure your pool is large enough for each lane and all the process actions that need to go into that lane.
For my diagram, the pool is the full page size. It’ll only have 4 lanes, and each lane will only have 3-4 actions, so I don’t have to worry too much about space.
Once you draw the pool, you need to add the lanes. The easiest way to do this is with the line tool (also found under Insert > Shapes, right above the rectangles).
Pro tip: Make these lines a different color than the pool outline and the directional lines for your process. Your eyes will be grateful.
Step 2. Label the players
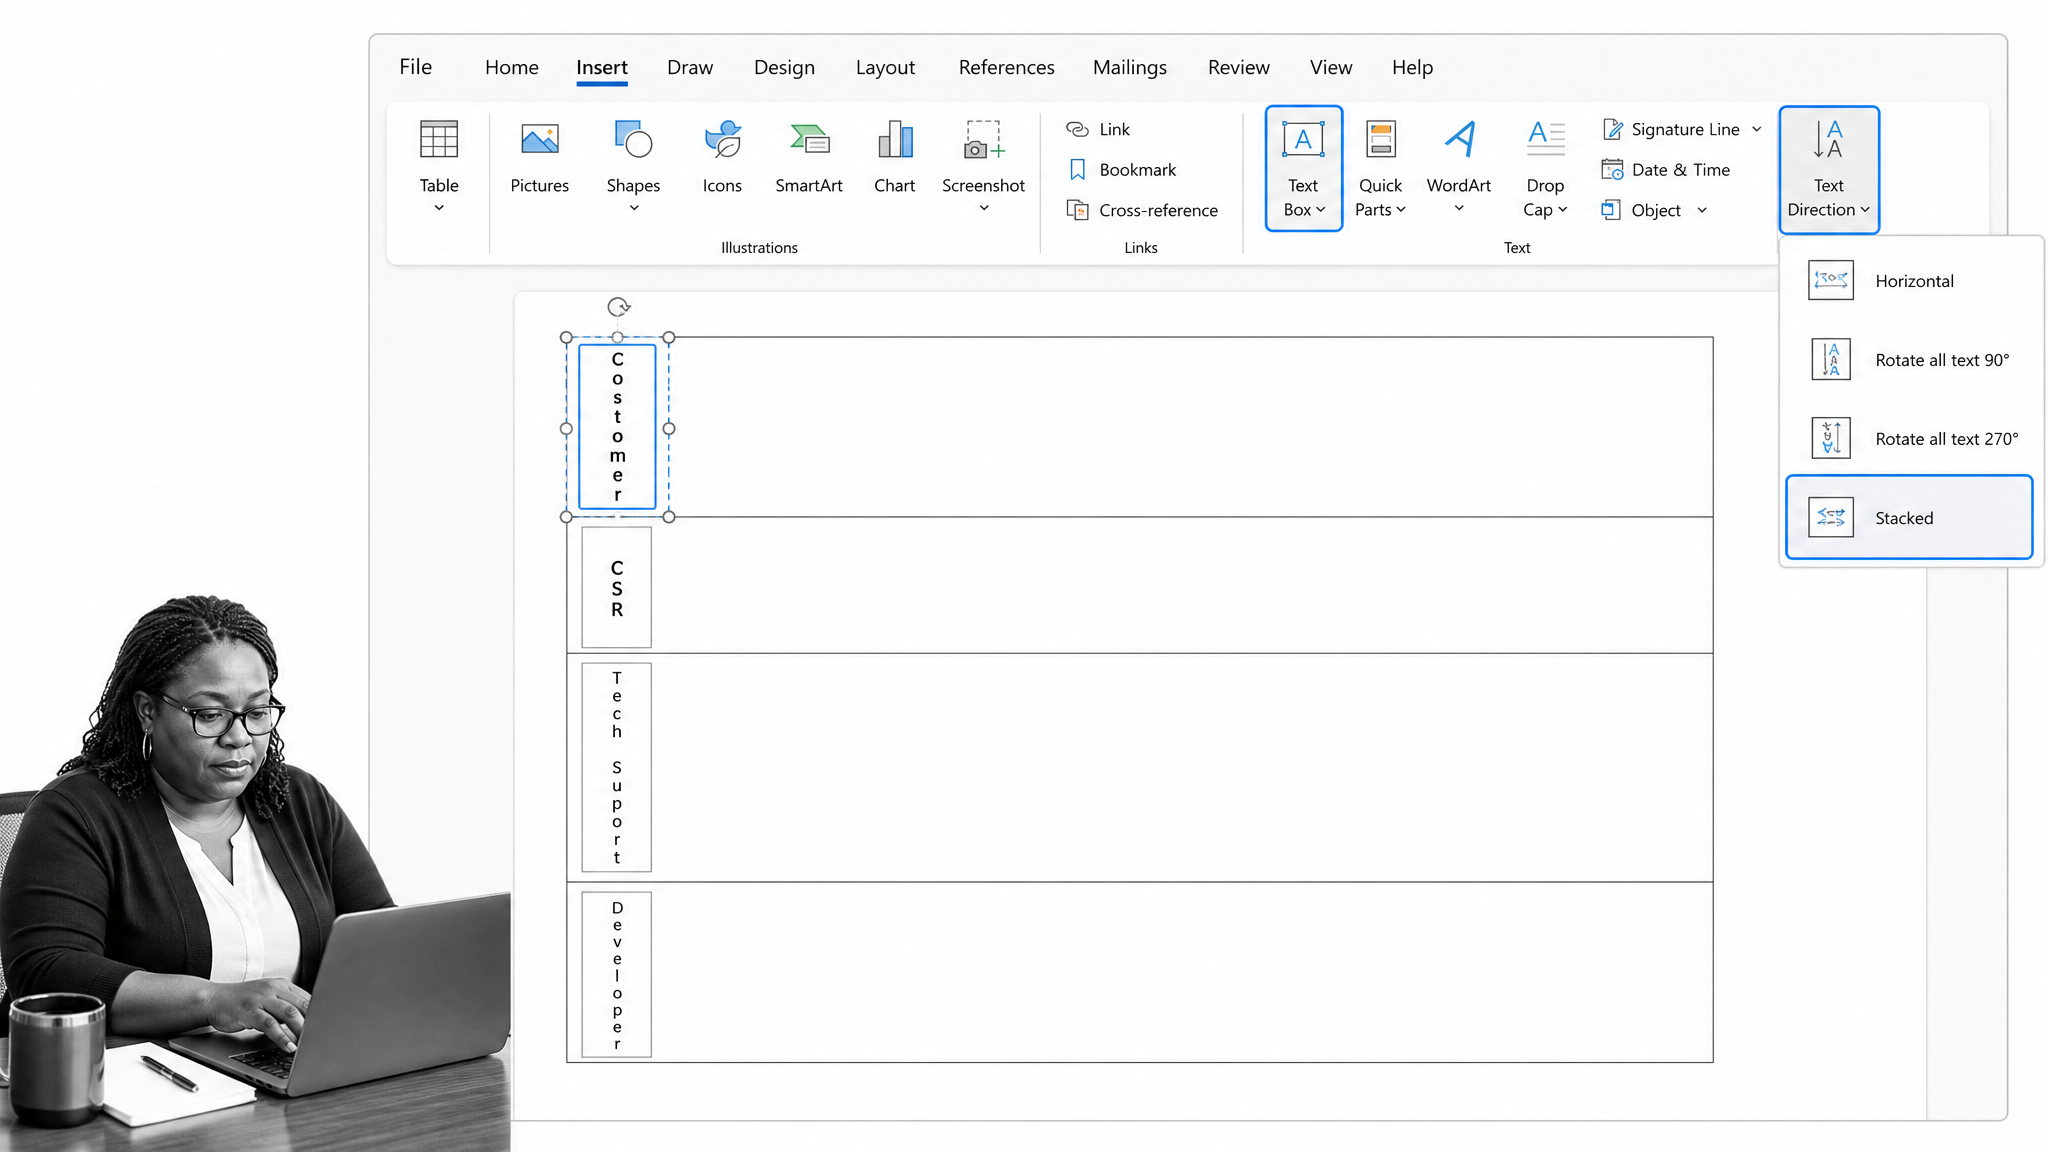
There are 2 ways you can do this:
- Insert a flowchart shape (I’ll get to that in Step 3)
- Insert a text box
I opted for a text box.
You’ll find this under the Insert tab, as well. (Most of the things you’ll be using are.)
The text box dropdown menu will show you a number of pre-made text boxes that aren’t particularly useful for creating swim lane diagrams. Below those, you’ll find the option to “Draw Text Box.”
This is what you want.
Draw a text box in your first lane where you want the label to go. You’ll see in the picture that I placed mine at the far-left side of the pool. I also changed the text direction using the format options that pop up once you’ve drawn your first text box.
You can adjust the font, size, color, fill, and alignment as well, but I wouldn’t worry too much about those things until the end.
You can draw a new text box for each swim lane or you can copy and paste the first box into each swim lane.
Step 3. Add actions
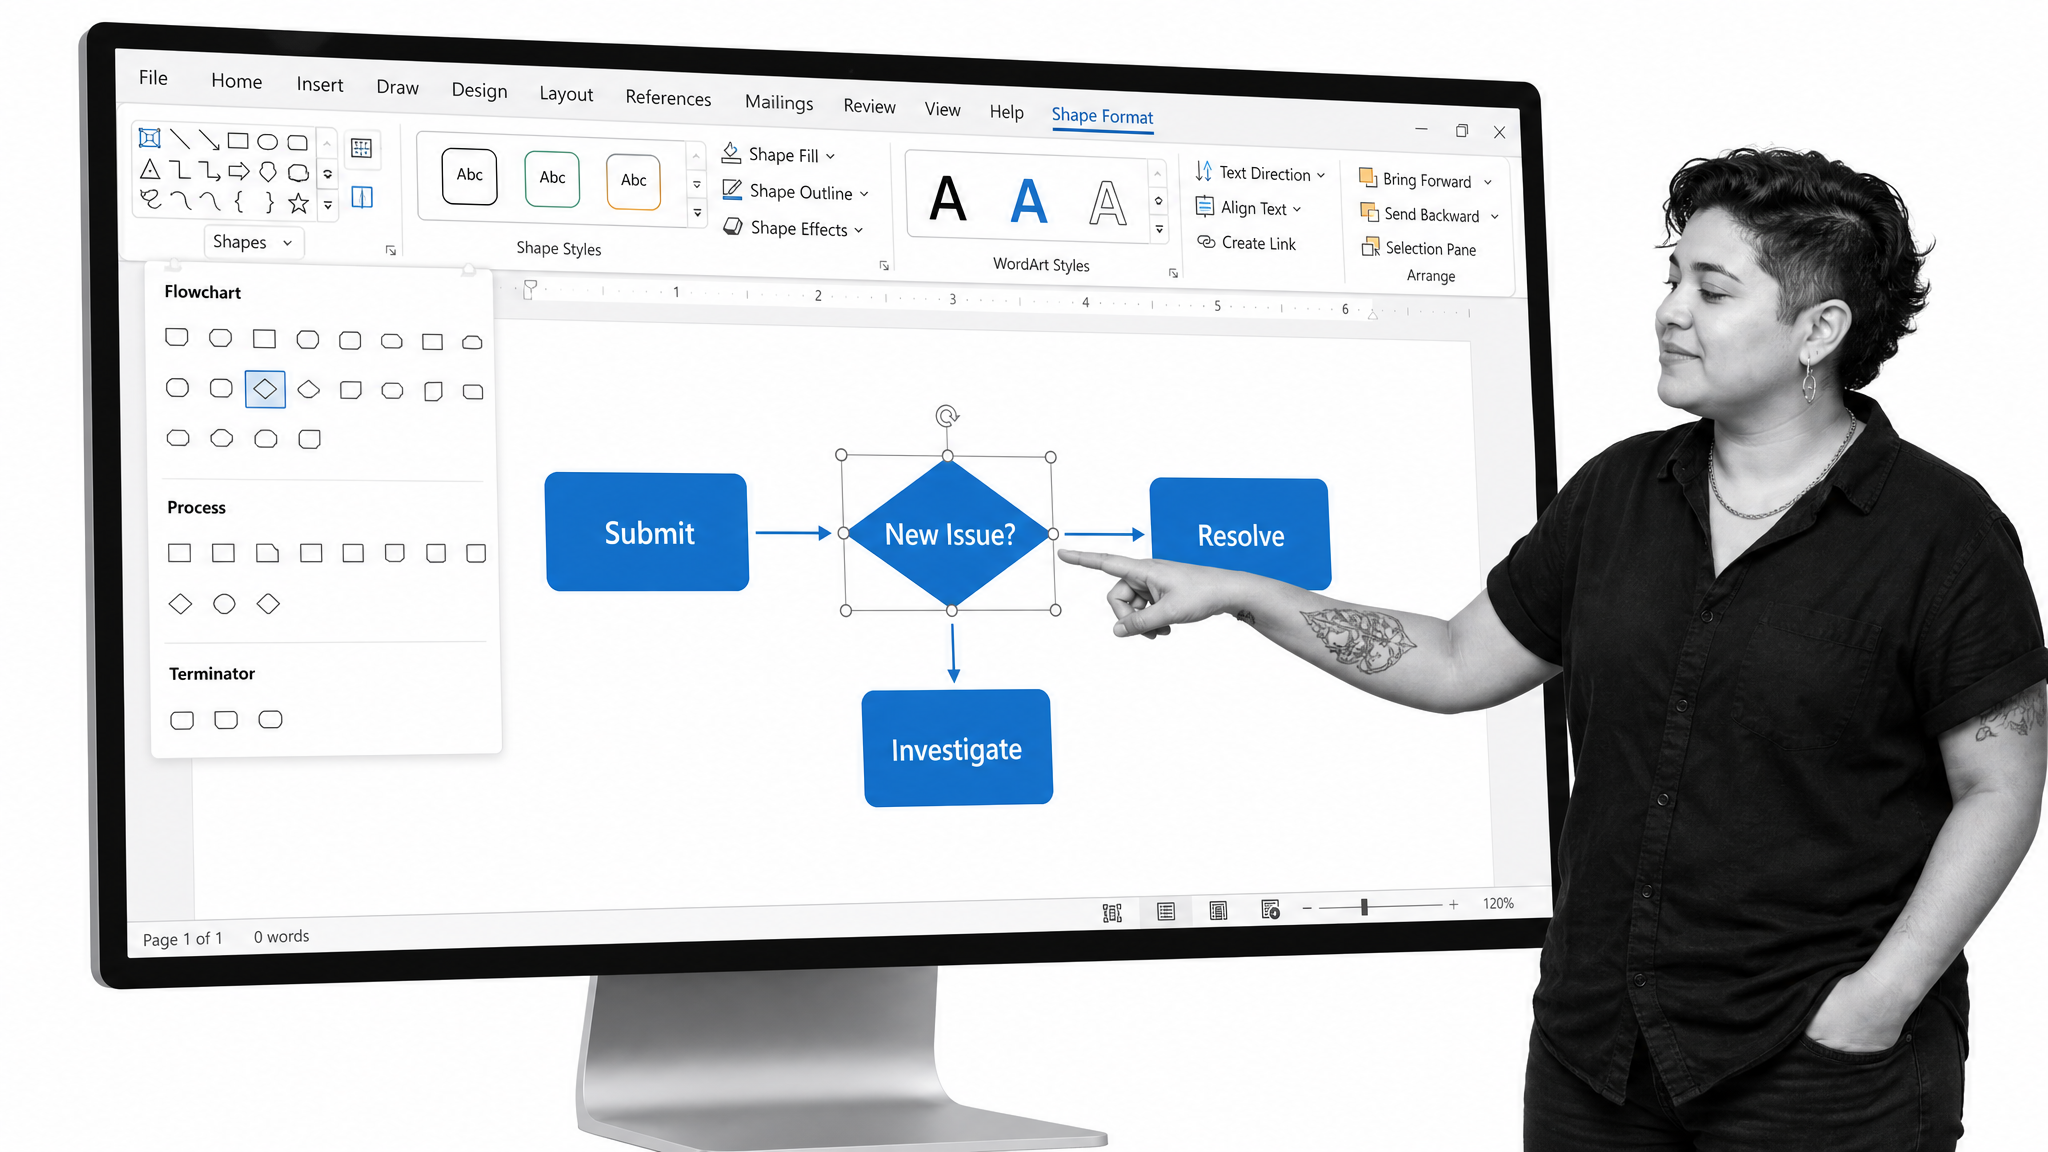
This is where we get into the flowchart shapes.
Go back to Insert > Shapes.
Towards the bottom of the list, you’ll see a section labeled “Flowchart.” Every shape you need for your swim lane diagram will be here. A few may look a little different than our graphic and some may have different names, but all your tools are right here.
The 4 shapes I’ve used in this diagram are:
- Terminator (pill shape)
- Decision (diamond)
- Process (rectangle)
- Document (wave shape)
The method you use for mapping the process’s actions will depend on what works best for you. You may find it easier to fill in all the actions for a single player at once, or you may prefer to fill in the actions chronologically.
Since I did this diagram on my own, and it’s not a process I use on a regular basis, I opted for the chronological approach. If you’re creating a diagram within a team, it may be easier for a representative from each department to outline their respective steps.
Don’t worry about the directional lines just yet. First, you want to make sure that all the necessary actions are accounted for, placed in the correct location, and how they all relate to each other is clear.
Step 4. Review the connections
As I said in the previous step, you want to make absolutely sure that you have all the actions and they’re in the correct place.
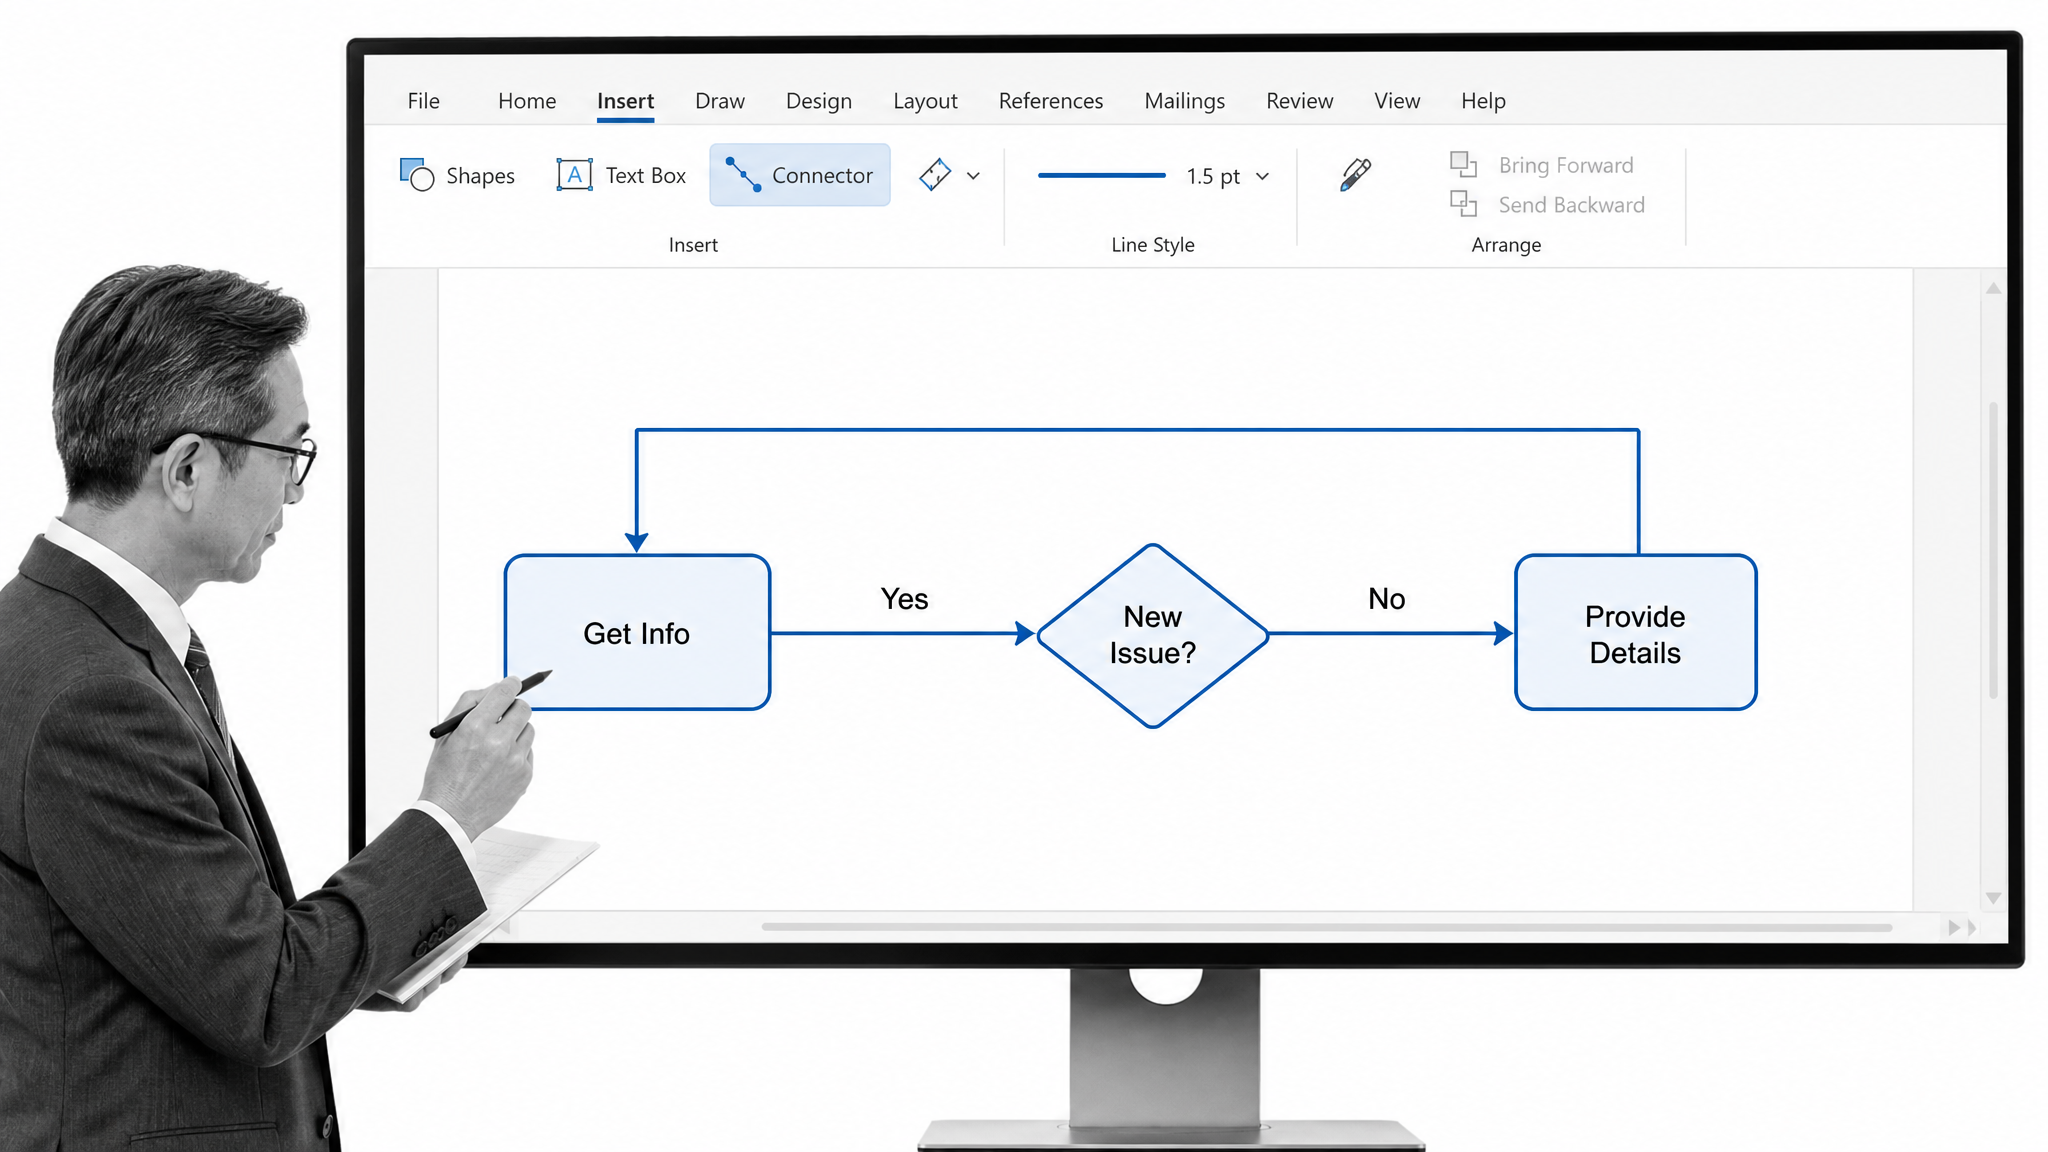
Once you’ve done that, you can start adding your directional lines. Go back to Insert > Shapes again and look at the line tool. The first 3 styles are the ones you’ll most likely need:
- A line with no arrows
- A line with an arrow at one end
- A line with arrows at both ends
Insert these lines in the order the process should follow. For example, in my diagram, “Submit ticket” begins the process. From there, the CSR must determine if it’s a new issue or not. I’ve drawn a line from the “Submit ticket” shape to the “New issue” shape, with an arrow pointing at “New issue.”
The double arrow should be used if there’s feedback between two actions. If you look at the CSR’s “Get more info” action and the customer’s “Provide details” action, there’s a double arrow connecting them. This indicates that these actions are, in a sense, a very small loop.
You’ll also notice that I’ve labeled the decision lines “yes” and “no.” You definitely want to include this so that it’s clear to anyone using the diagram which choice should be selected under which circumstances.
Step 5. Approve the diagram
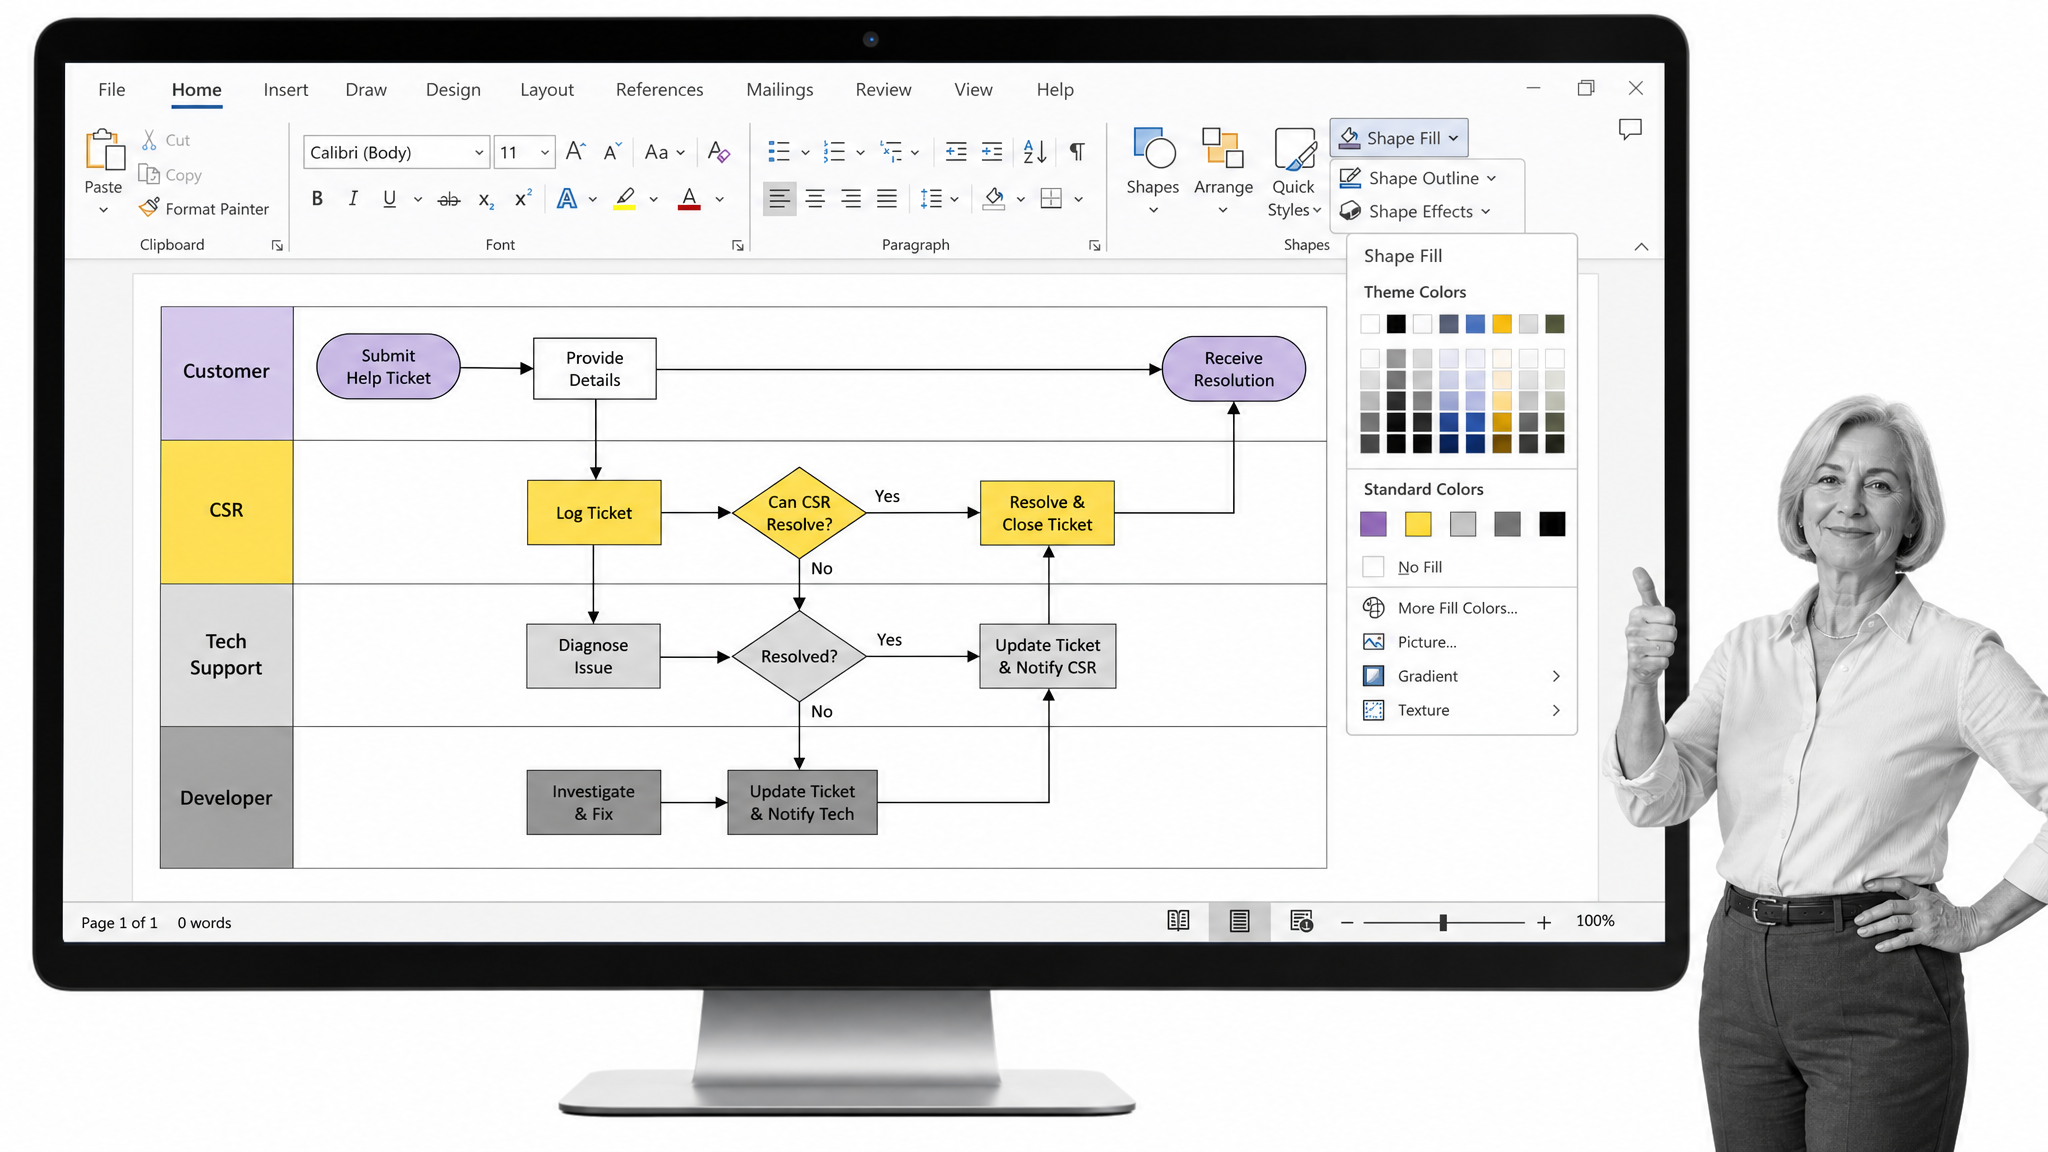
At this point, your diagram should be completely mapped out with all of the players, actions, and connections clearly defined and labeled. Now is when you can go all out with fonts, colors, and other formatting to make your diagram really pop. There isn’t a set color scheme for swim lane diagrams, so use what makes sense for you. That may mean all actions completed by the same department are the same color, or specific actions have the same color no matter who is completing them.
In my diagram, I chose to color-code the actions:
- Terminator actions are blue
- Decision actions are green
- Process actions are red
- Document actions are yellow
Time to get out of the pool
A swim lane diagram is a tool for clarifying ownership, sequence, and handoffs. Like any tool, it has limits, and it may not be the right format for every situation. For cross-functional work, though, few formats make each role and responsibility as easy to scan.
Keep the map current as customer needs, employee responsibilities, and operating rules change. A diagram can explain how work should move, but it does not execute or enforce the work on its own.
Process Street is a single Compliance Operations Platform, with Docs for governed process knowledge, Ops for running trackable workflows, and built-in AI to help teams execute and improve work. That turns a clear process map into assigned, trackable work with approvals, evidence, and an audit trail.
The post A Step-by-Step Guide to Creating an Effective Swim Lane Diagram first appeared on Process Street | Compliance Operations Platform.


0 Commentaires