
Unified Modeling Language (UML) is a visual language for describing how a system is structured and how it behaves. A UML diagram can map software classes and components, show how people interact with a system, or trace how actions and decisions move through a business process. It also provides a consistent modeling optimization method for comparing the current system with a proposed change.
For process modeling, the most useful member of the UML family is usually the activity diagram. It gives teams a shared view of actions, responsibility, branching logic, and handoffs, making it easier to turn a process idea into work that can be tested and improved.
UML has more than a dozen diagram types, but practical use rarely requires the full language. Grady Booch, one of UML’s creators, recommends using it with a “very light touch” and discarding most diagrams once they have helped a team reason and communicate.
The language still has major advantages: flexibility, an abundance of diagramming tools, and the capacity to model systems from both structural and behavioral perspectives. The same range of capability can feel overwhelming, however, if a team tries to learn the entire UML specification before solving a practical problem. As Booch put it, “you need about 20% of the UML to do 80%” of the design work.
That principle matters for business process modeling. A diagram should make a system easier to understand, not turn simple work into a notation exercise. The guide below covers UML’s history, its major diagram families, activity-diagram components, and the path from a static model to an executable workflow.
Although UML began in software engineering, UML diagrams can be applied beyond software development. They help analysts analyze, design, and implement software-based systems, but they also provide a shared way to visualize organizational activities. Different types serve different purposes and have significant variances in complexity, so the useful skill is choosing the smallest model that answers the current question.
The Three Amigos: A brief history of UML
The roots of UML reach back to the 1960s, when Norwegian computer scientists Ole-Johan Dahl and Kristen Nygaard developed Simula, an early object-oriented programming language. By the 1980s, object-oriented software development had expanded rapidly, but engineers lacked a consistent way to describe increasingly complex systems.
Between 1989 and 1994, the number of object-oriented methods grew from fewer than 10 to more than 50. Each method brought useful ideas, but the fragmented notation made it harder for teams and tools to work together.
In the mid-1990s, Grady Booch, James Rumbaugh, and Ivar Jacobson began consolidating ideas from the Booch method, Object Modeling Technique, and Objectory. The three became known as the Three Amigos. Their goal was to create a shared modeling language that could stabilize the field and let engineers focus on the systems they were building.
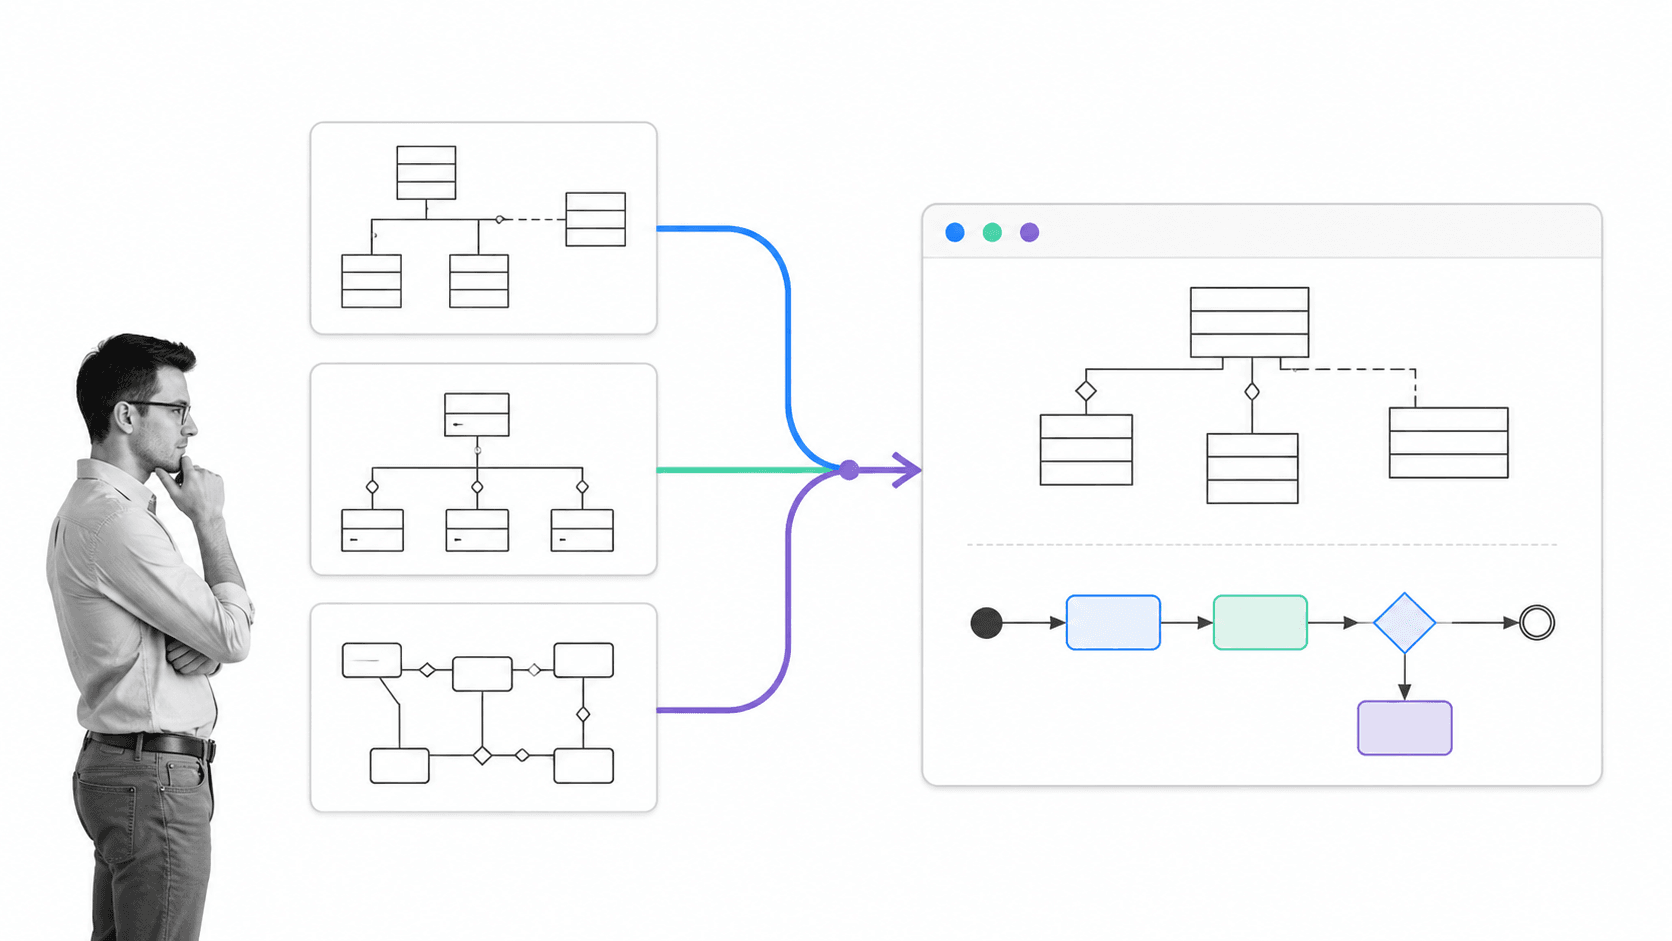
The UML effort officially began in October 1994, and the UML 0.8 draft appeared in October 1995. By unifying semantics and notation, Booch, Rumbaugh, and Jacobson gave teams a common language instead of another competing method.
The Object Management Group adopted UML 2.0 in 2005. The current formal specification is UML 2.5.1. The durable lesson is not that every team should use every element of UML. It is that a shared visual language reduces ambiguity when people need to understand the same system.
Throughout the following decade, UML continued to develop as major software vendors and standards bodies aligned around it. What began as a fragmented area of software development with dozens of methods became a common notation that remains useful in software design, systems engineering, and enterprise process modeling.
The most important takeaway from the history of UML is that a large number of individuals improved the language over many decades. Booch, James Rumbaugh, and Ivar Jacobson were able to consolidate ideas from different engineers into unified semantics and notation. That common language allowed software engineers to evolve together rather than maintain incompatible methods.
A quick look at the 2 broad types of UML diagrams
UML diagrams fall into two broad families: structural diagrams and behavioral diagrams. Interaction diagrams are a behavioral subgroup that focuses on messages exchanged among parts of a system.
Structural diagrams
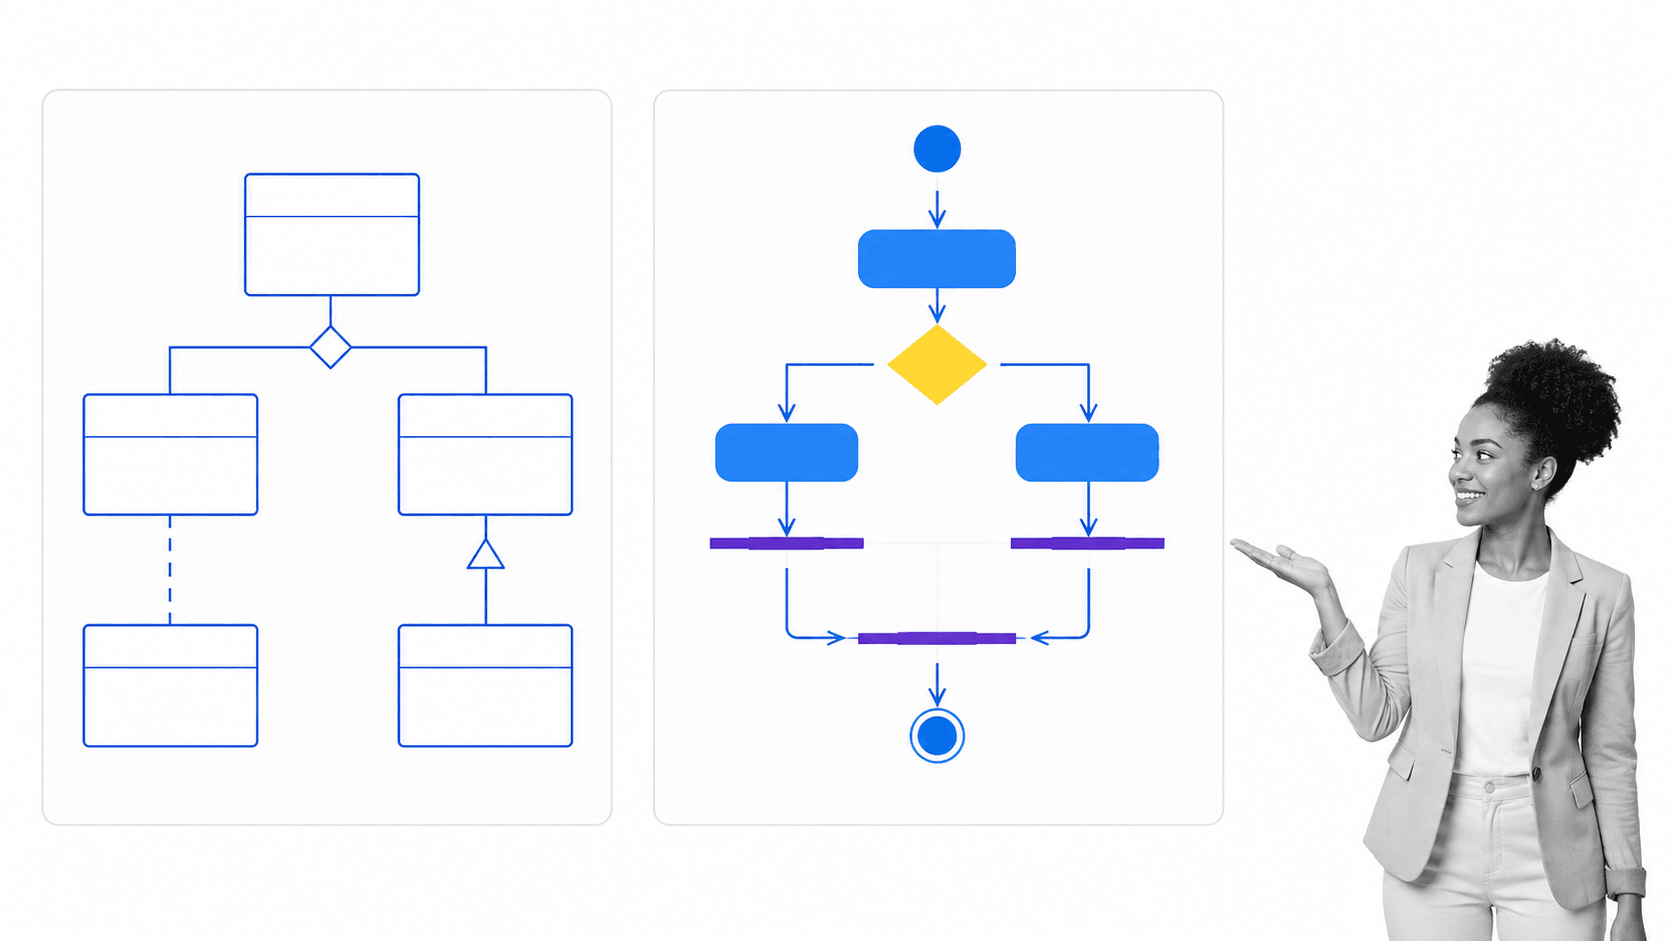
Structural diagrams represent the static parts of a system. UML 2.5.1 defines seven: class, object, component, composite structure, package, deployment, and profile diagrams.
- Class diagrams model classes, attributes, operations, and relationships.
- Object diagrams show instances of classes at a particular moment.
- Component and composite structure diagrams show modular parts and their internal collaboration.
- Package diagrams organize model elements into groups and dependencies.
- Deployment diagrams map software artifacts to infrastructure.
- Profile diagrams extend UML for a particular domain or platform.
A class diagram is especially useful during system design because it gives both a detailed view and a quick overview of the model. A hotel-management class diagram, for example, might connect guests, rooms, reservations, payments, and staff while showing the data and operations associated with each class.
That combination of detail and big-picture structure is why class diagrams are widely used during system construction. They let software engineers inspect relationships between objects without losing sight of the underlying structure of the software system.
Behavioral diagrams
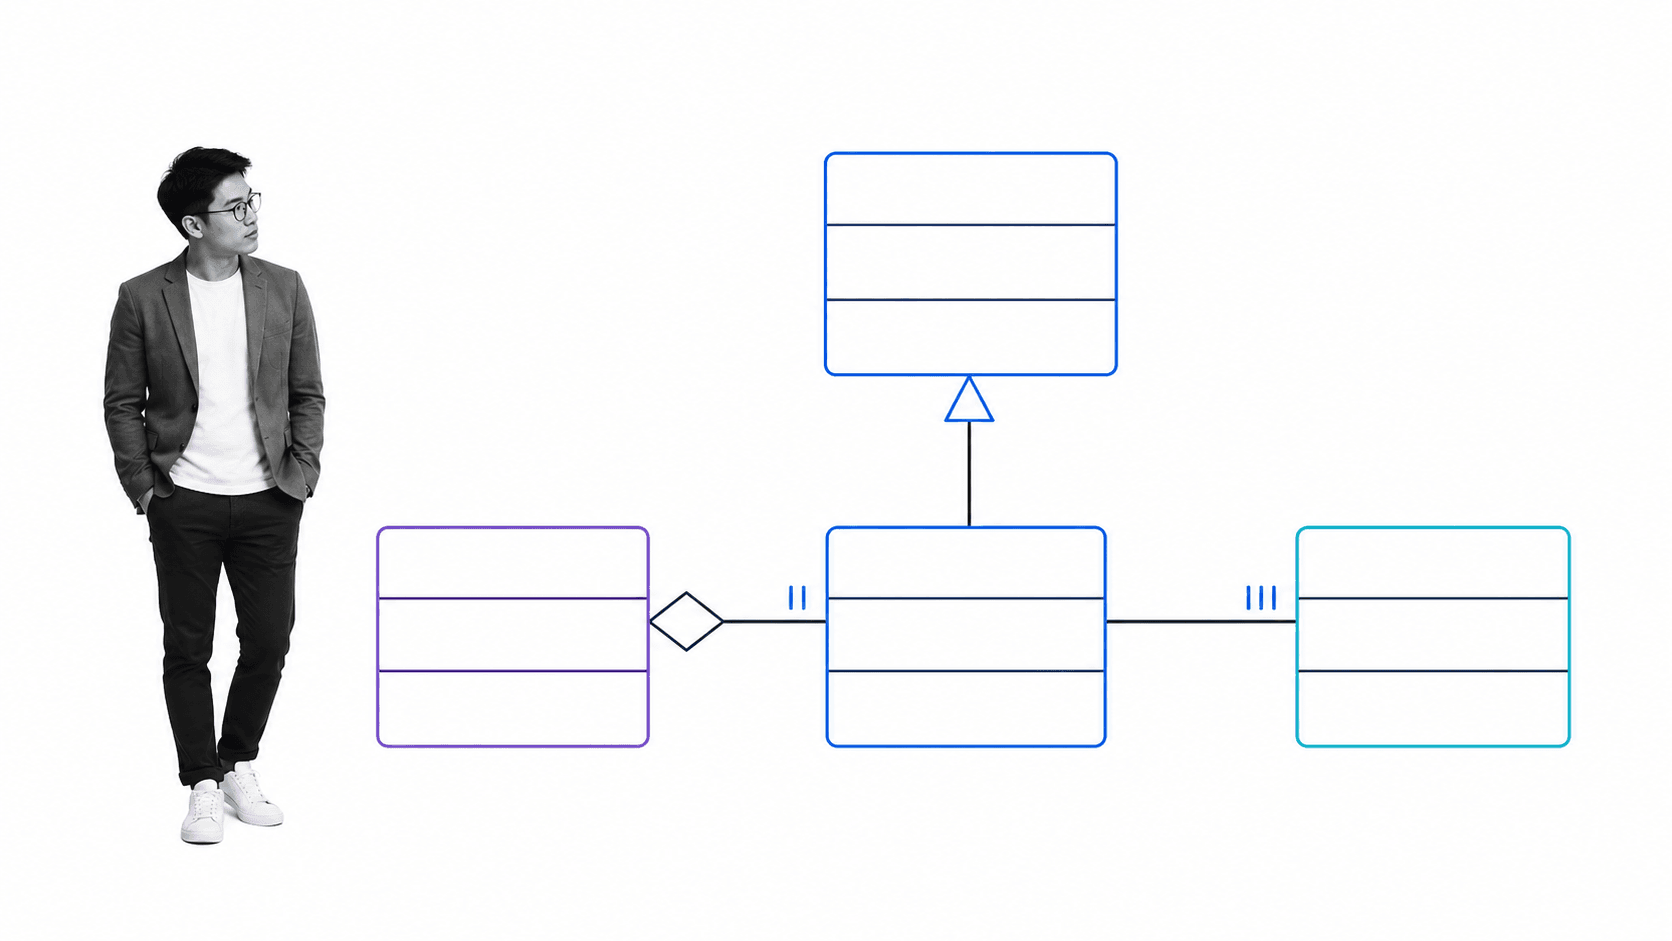
Behavioral diagrams describe what a system does over time. The seven are use case, activity, state machine, sequence, communication, interaction overview, and timing diagrams. Sequence, communication, interaction overview, and timing diagrams form the interaction subgroup.
- A use case diagram shows how people, organizations, or external systems interact with a system.
- A sequence diagram shows which messages participants exchange and in what order.
- A communication diagram, formerly called a collaboration diagram, emphasizes relationships among participants.
- A state machine diagram, formerly called a statechart diagram, shows how events move an object between states.
- An activity diagram models control and object flow across actions.
Choose the diagram that answers the question at hand. Use a class diagram for system structure, a use case diagram for user goals, a sequence diagram for message order, a deployment diagram for infrastructure, and an activity diagram for process flow.
Use case diagrams are intentionally uncomplicated. Their purpose is to give a clear picture of how actors interact with a particular system and whether those interactions match the intended behavior. Sequence diagrams add the order of communication, while activity diagrams focus on the progression of actions and conditions.
Why activity diagrams are the most suitable for process modeling
Business process modeling documents the actions, decisions, roles, and handoffs that produce an outcome. A useful process model identifies the actors involved, shows how their work connects, and traces the end-to-end journey through the organization.
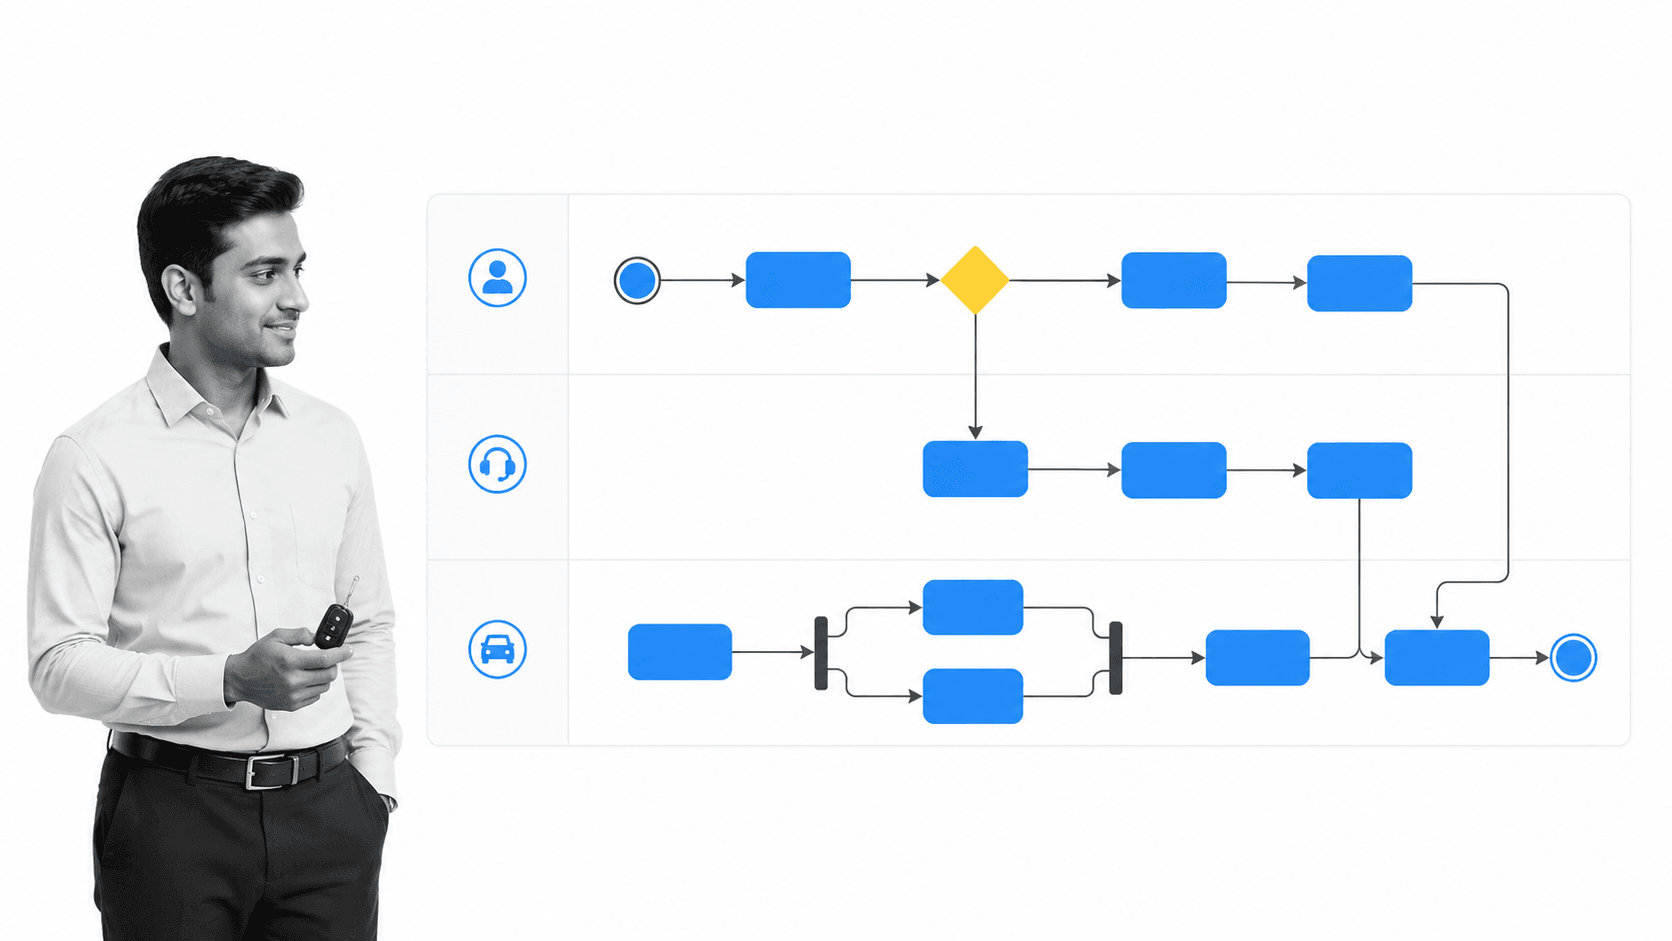
An activity diagram fits that job because it is designed around flow. It can show sequential work, parallel work, decisions, loops, and the point where responsibility moves from one role or team to another. Swimlanes are optional activity partitions that make those responsibilities visible; they are not another name for every activity diagram.
Like an advanced flowchart, the activity diagram illustrates movement from activity to activity. Unlike a basic flowchart, it has defined notation for conditional branches, concurrent work, object flow, and responsibility. That makes it suitable for representing many kinds of business workflows while still connecting the model to wider system behavior.
3 main benefits of activity diagrams
- Accessible notation: Activity diagrams are often easier for analysts and stakeholders to understand than more technical UML diagrams.
- Visible responsibility and conditions: Partitions, decisions, and guard conditions show who acts and which route the process follows.
- Connection to system behavior: An activity diagram can describe the steps behind a use case while keeping the end-to-end process visible.
These benefits are most apparent when several actors are involved. An analyst can display multiple conditions within one workflow, separate activities by role through swimlanes, and describe the steps performed in a UML use case without forcing every stakeholder to interpret a more complicated system model.
Consider a car-hire process. The flow can begin with an availability check, branch when no car is available, continue through quote acceptance and payment, split into parallel preparation work, and finish when the customer returns the vehicle. The example is specific enough to test, but simple enough to discuss with everyone involved.
For a detailed walkthrough, use this 10-step UML activity-diagram tutorial.
Overview of the basic components
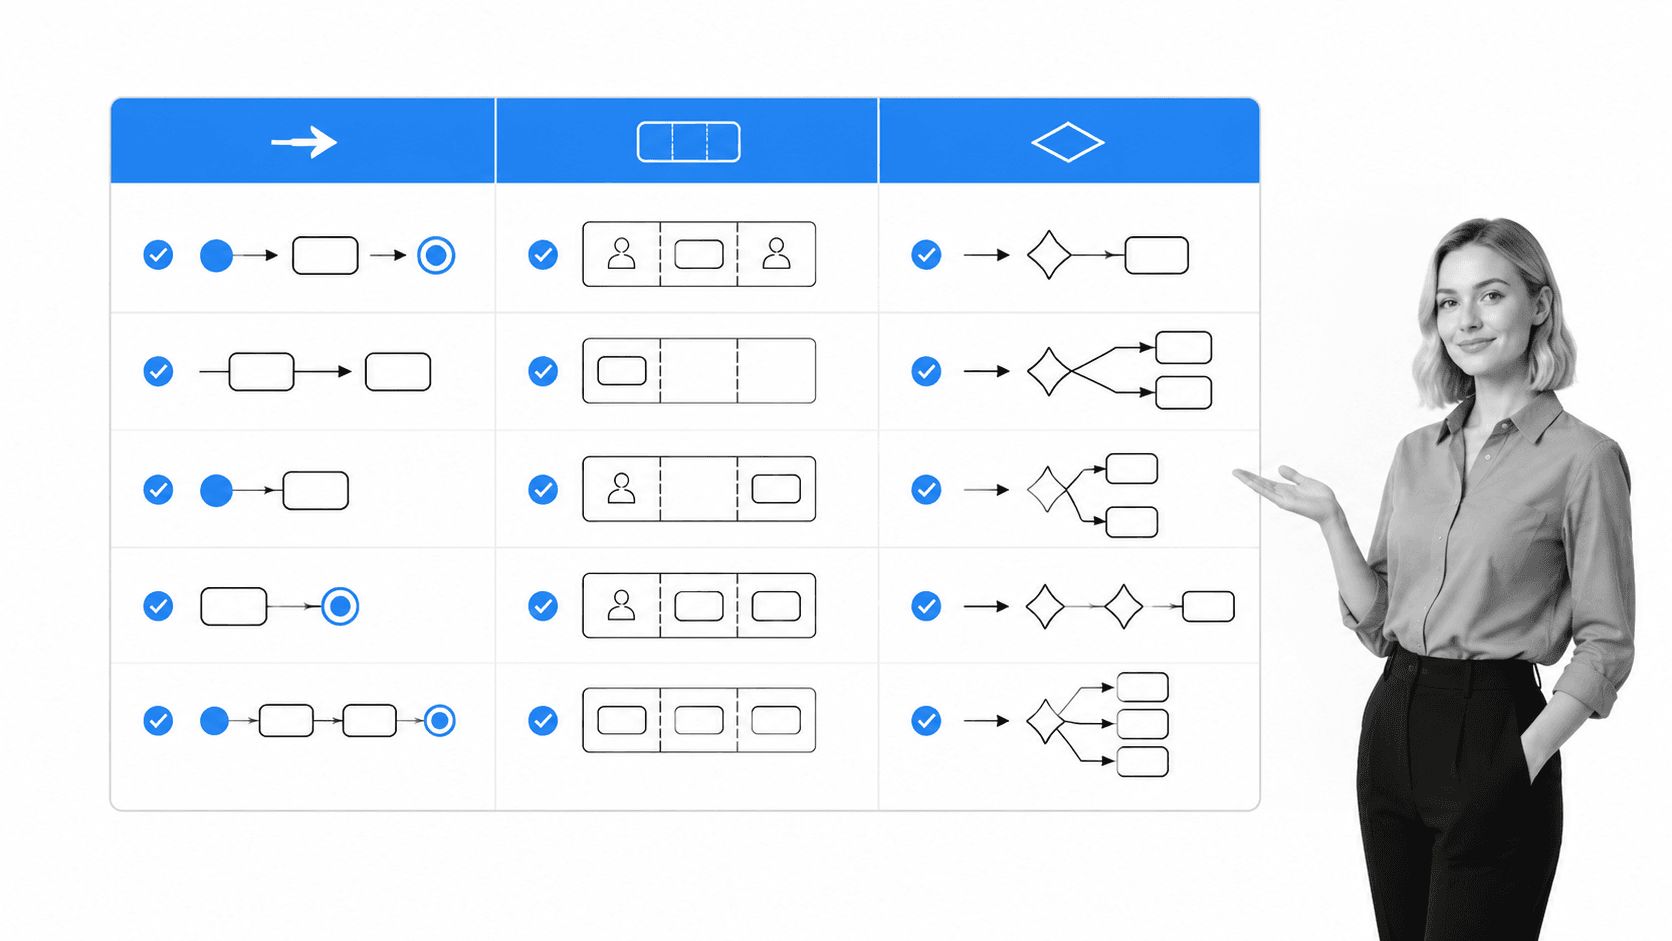
- Initial node: A filled circle that marks where the activity begins.
- Action: A task or behavior, usually shown as a rounded rectangle.
- Control flow: An arrow that shows the order in which actions can occur.
- Decision and merge nodes: Diamonds that split a flow by condition or bring alternative paths back together.
- Fork and join nodes: Bars that start parallel paths or synchronize them.
- Activity final node: A bullseye symbol that ends the entire activity.
- Activity partitions: Optional rows or columns that group actions by role, team, or system.
Start with the main outcome, map the common path, add only the decisions that change the work, and then assign each action to the responsible role. Validate the diagram with people who perform the process before adding exceptional cases. This keeps the model useful and follows Booch’s light-touch principle.
How to create a useful activity diagram
- Define the service or result the activity must provide, including a clear start node and end state.
- List the actions taken within the process and place them in the intended sequence.
- Add each conditional branch as a decision node with a single input and two or more valid outputs.
- Use control flows, connector arrows, and fork and join symbols to show movement and concurrent work.
- Add activity partitions only when actors within the workflow need clearly separated responsibility.
- Review the diagram with both analysts and the employees following the process, then remove detail that does not help them make a decision.
The result should be detailed enough to describe the different activities and conditions, but clear enough for stakeholders to fully comprehend. If the model cannot be explained without decoding a large portion of the UML metamodel, simplify it.
Make your activity diagrams actionable
A diagram creates value when it changes how work is performed. After the team reviews the model, translate each action into a task, each decision into a rule, each swimlane into ownership, and each final state into a measurable result.
Activity diagrams often fail at this boundary. Software engineers, operations leaders, and subject-matter experts create and review the model, but the completed diagram is never applied to the current process. The notation may be accurate while the actual work continues unchanged. An actionable diagram needs both a clear model and a mechanism for execution.
The model also needs an operating home. Process documentation explains the intent and standards. An executable workflow coordinates the work. Reports and operational evidence show whether the process is producing the expected result. That model, execute, observe, and improve cycle prevents the diagram from becoming a static artifact.
Process Street is a single Compliance Operations Platform with Docs and Ops capability areas plus built-in AI. Teams can document a process, turn its activity flow into a governed workflow, assign ownership, collect evidence, route approvals, and monitor workflow runs in one product.
How the activity diagram can be used for optimizing business processes
A UML activity diagram provides the logic for an executable process. Workflow-diagram software closes the gap between the model and day-to-day execution by giving each action an owner, due state, data requirement, and completion record.
The mapping is direct: actions become workflow tasks, activity partitions become assignments, decision nodes become conditional logic, and review points become approvals. Teams can start from the Library, run a workflow, use task assignments, and follow execution in Reports.
As decisions are made during a workflow run, conditional logic adapts the path and presents only the relevant tasks. The original decision node is still recognizable, but it now controls who receives work, which evidence must be collected, and whether an approval is required before the process can continue.
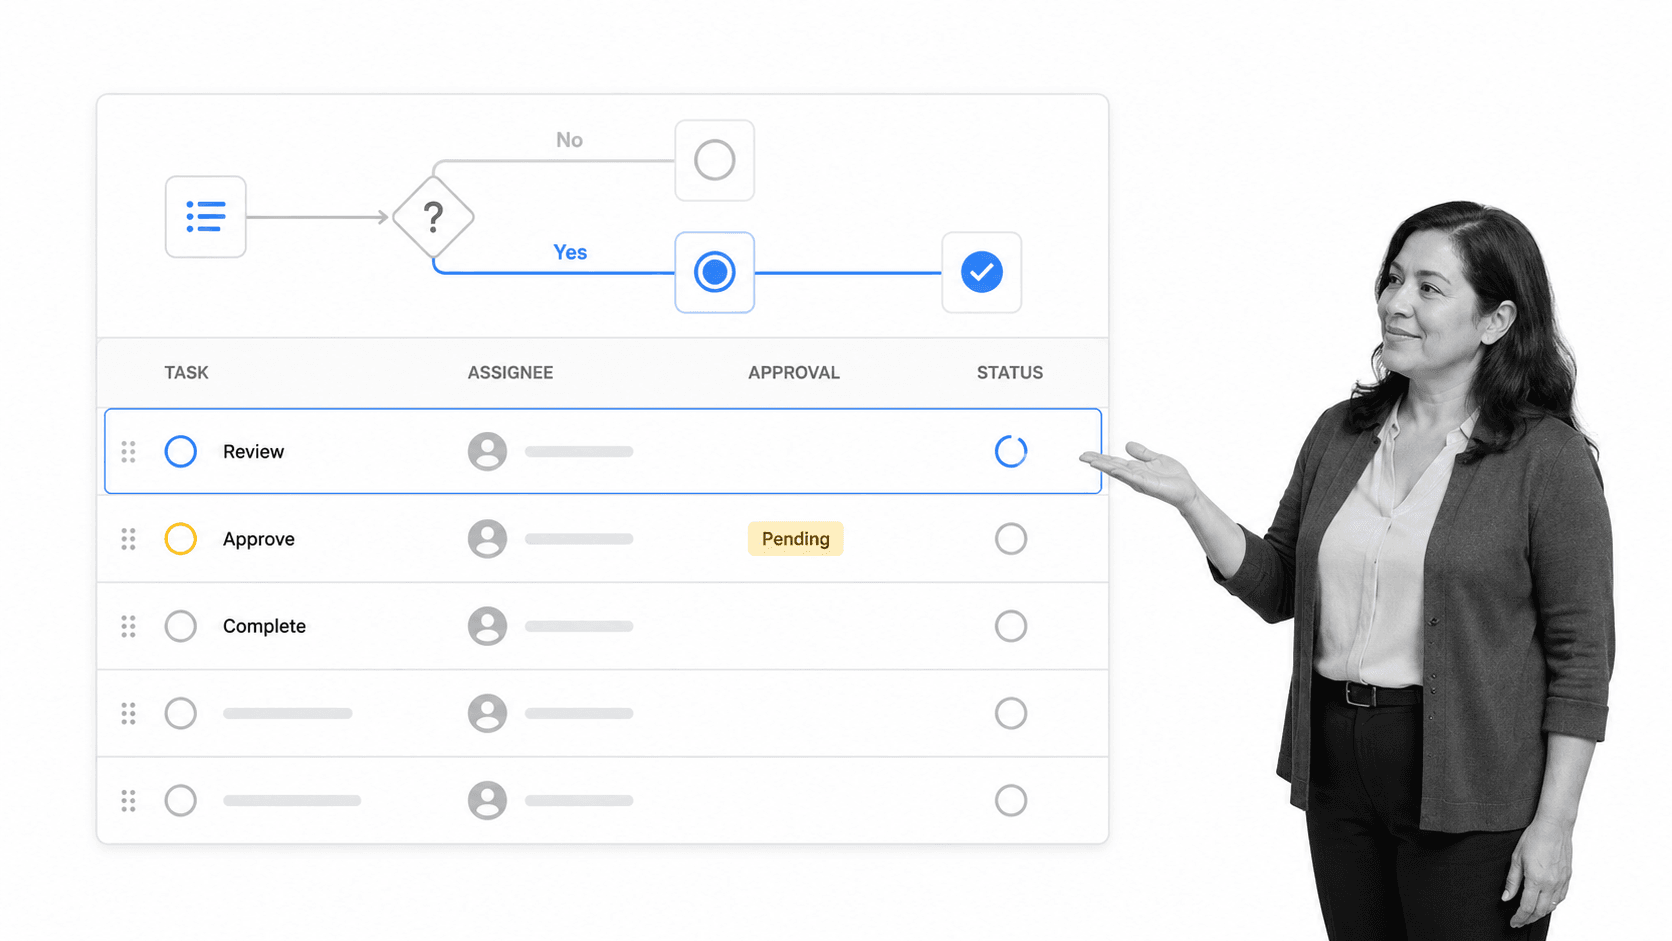
When a decision node is reached, the workflow can reveal only the tasks relevant to the chosen path. Direct, universal integrations connect Process Street to more than 5,000 systems, and an AI agent can build a new integration when needed. This lets the process coordinate work across the existing technology stack without making Zapier or any other connector the center of the operating model. See AI agent orchestration for the current integration approach.
Once the process runs, operational evidence replaces guesswork. Owners can compare actual paths with the intended model, find bottlenecks and repeated exceptions, and decide whether the diagram, workflow, training, or underlying policy needs to change.
This is where optimization becomes continuous. Managers and process owners can monitor performance, identify opportunities for improvement, and formulate clear action items. Team members can show where unique needs or unforeseen changes cause the workflow to branch in ways the original model did not anticipate.
Involve employees in process optimization initiatives
People who perform a process see failure modes that a diagram alone cannot reveal. Involve them in process design, give them a clear channel for feedback, assign process-improvement owners, and show how suggestions become decisions or action items.
- Create a culture of open and honest communication during onboarding and ongoing training.
- Provide channels for employees to voice suggestions and concerns at the point where work happens.
- Identify process-improvement champions who can encourage contribution from other employees.
- Make process owners responsible for evaluating input and communicating what will change.
- Recognize useful contributions and give employees the context needed to understand the final decision.
This is an operational practice, not a morale slogan. Gallup’s latest guidance reports that only 28% of employees strongly agree their opinions count at work, while its large-scale Q12 meta-analysis associates stronger engagement with better business outcomes. A process-review routine gives employee voice a specific place to influence execution.
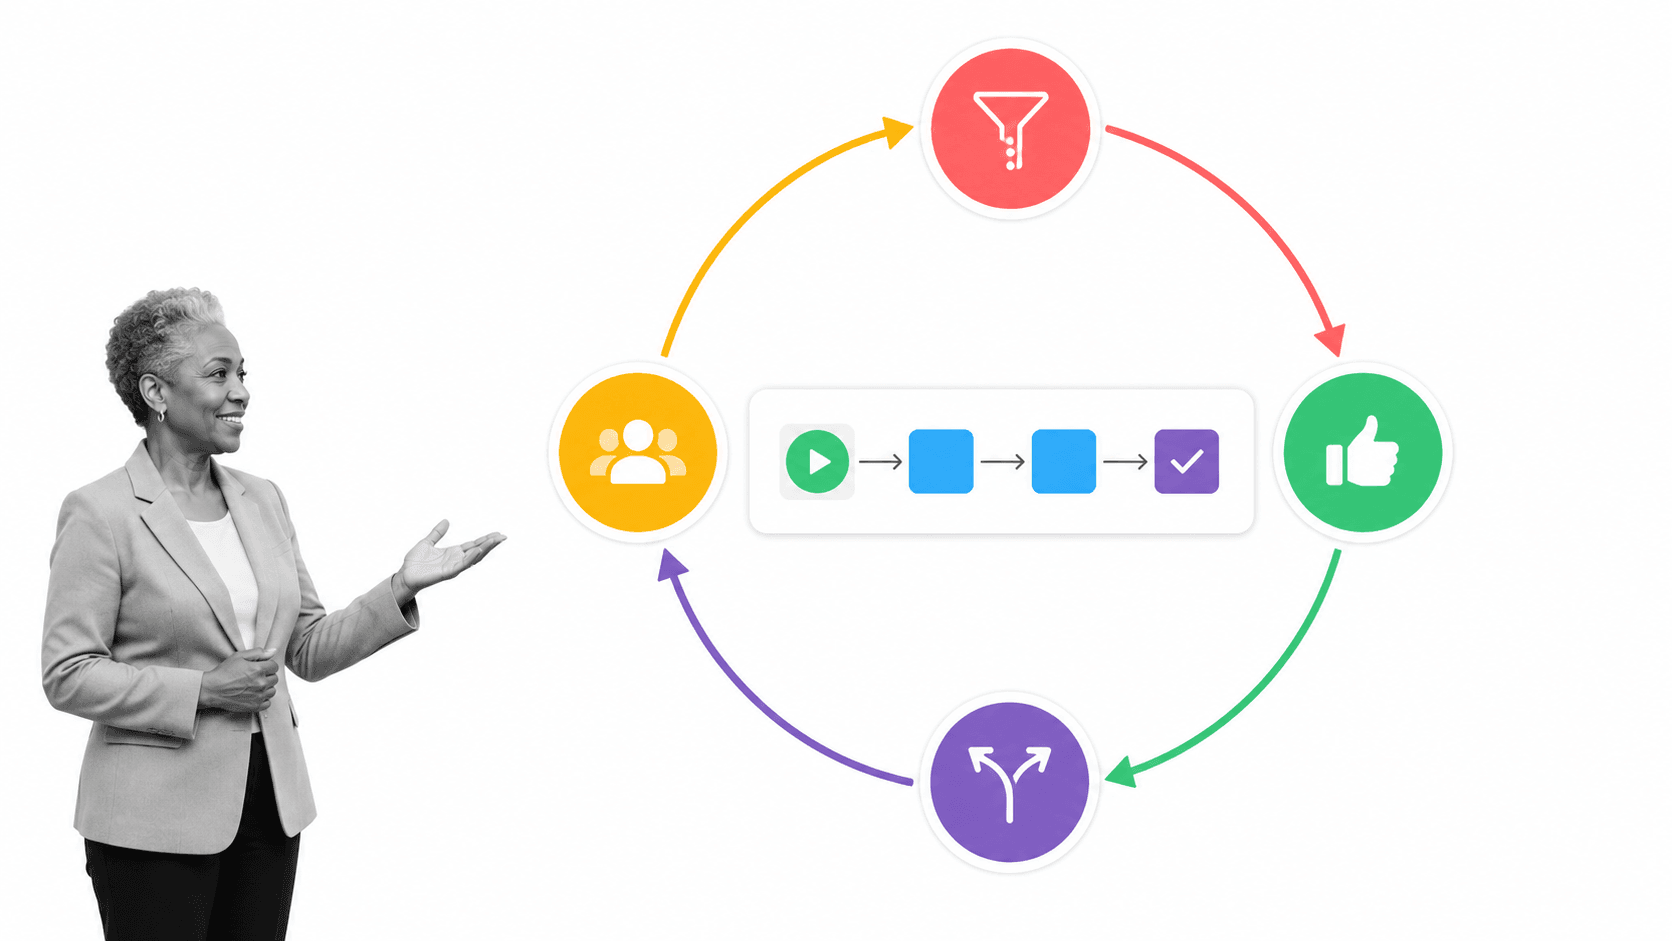
Ask these four questions whenever the process is formally reviewed:
- Which parts of the process are causing inefficiency?
- Which parts work especially well?
- Is the process flexible enough to adapt to unforeseen changes?
- Which iterations would improve user adoption?
Turn the answers into named actions, update the model and workflow together, and review the effect in the next cycle. The process stays understandable because the diagram reflects reality, and it stays useful because the workflow records what actually happened.
The Process for Optimizing a Process workflow template provides a structured starting point for recording the review and following through on improvements.
The post A Simple Guide to Process Modeling & Optimization with UML Diagrams first appeared on Process Street | Compliance Operations Platform.


0 Commentaires