
An article built on irresistible original data does more than summarize what other people have said. It asks a focused question, gathers defensible evidence, explains the method, and turns the result into a useful story. That is the core of data-driven content: the evidence gives readers something concrete to learn from, test, cite, and share.
When I was about seven years old, I made a deliberate decision to stop caring about math. I sat closer to the back of the class, stopped answering questions, and scraped through the subject with borderline grades. It wasn’t until I started working at Process Street that I cared about data, charts, spreadsheets, and correlations because they helped me answer real questions.
Research and data-manipulation skills matter whenever you need to devise your own solution. They are also valuable marketing skills. Product releases and funding announcements are newsworthy for a moment; rigorous original research can stay useful because it supplies evidence that did not exist before.
The huge benefits of writing detailed studies with original data

My SaaS pricing page study was syndicated by The Next Web and earned references from a range of other sites. The useful lesson is not that every study will rank first or attract a predictable number of links. It is that a clear, well-supported finding gives journalists, analysts, and other writers a primary source they can cite.

Here are several studies I have written:
- I Analyzed 250 SaaS Pricing Pages: Here’s What I Found
- I Analyzed the Copy on 87 SaaS Startup Landing Pages: Here’s What I Found
- I Analyzed 12,844 Tweets to Find How the Top SaaS Companies Do Twitter Support
Each project involved defining a population, gathering records, formatting them into a dataset, and looking for patterns related to a hypothesis. The work is slower than opinion-led writing, but the result is harder to imitate and easier for a reader to verify.
Come up with one big hypothesis
A hypothesis is a statement you make without seeing the full data, something to prove or disprove. It gives the collection process a boundary and keeps you from searching for any pattern that happens to support the story you want to tell. Examples include:
- The bigger the SaaS company, the lower the quality of support.
- Enterprise SaaS companies use fewer benefit-driven headlines.
- Smaller SaaS companies are more likely to publish their pricing.
These all came from casual observations, and they were questions I tried to find the answer to on Google before setting off to do my own research. Since the data for these questions was not available, I realized that was a gap in the available content and a chance to publish original, never-seen-before data.
Before collecting anything, turn the observation into an answerable research question. Define the population, the unit you will measure, the time window, and the evidence that would count against the hypothesis. A useful question is narrow enough to test and important enough that somebody would change a decision after seeing the answer.
Scrape source data and lists
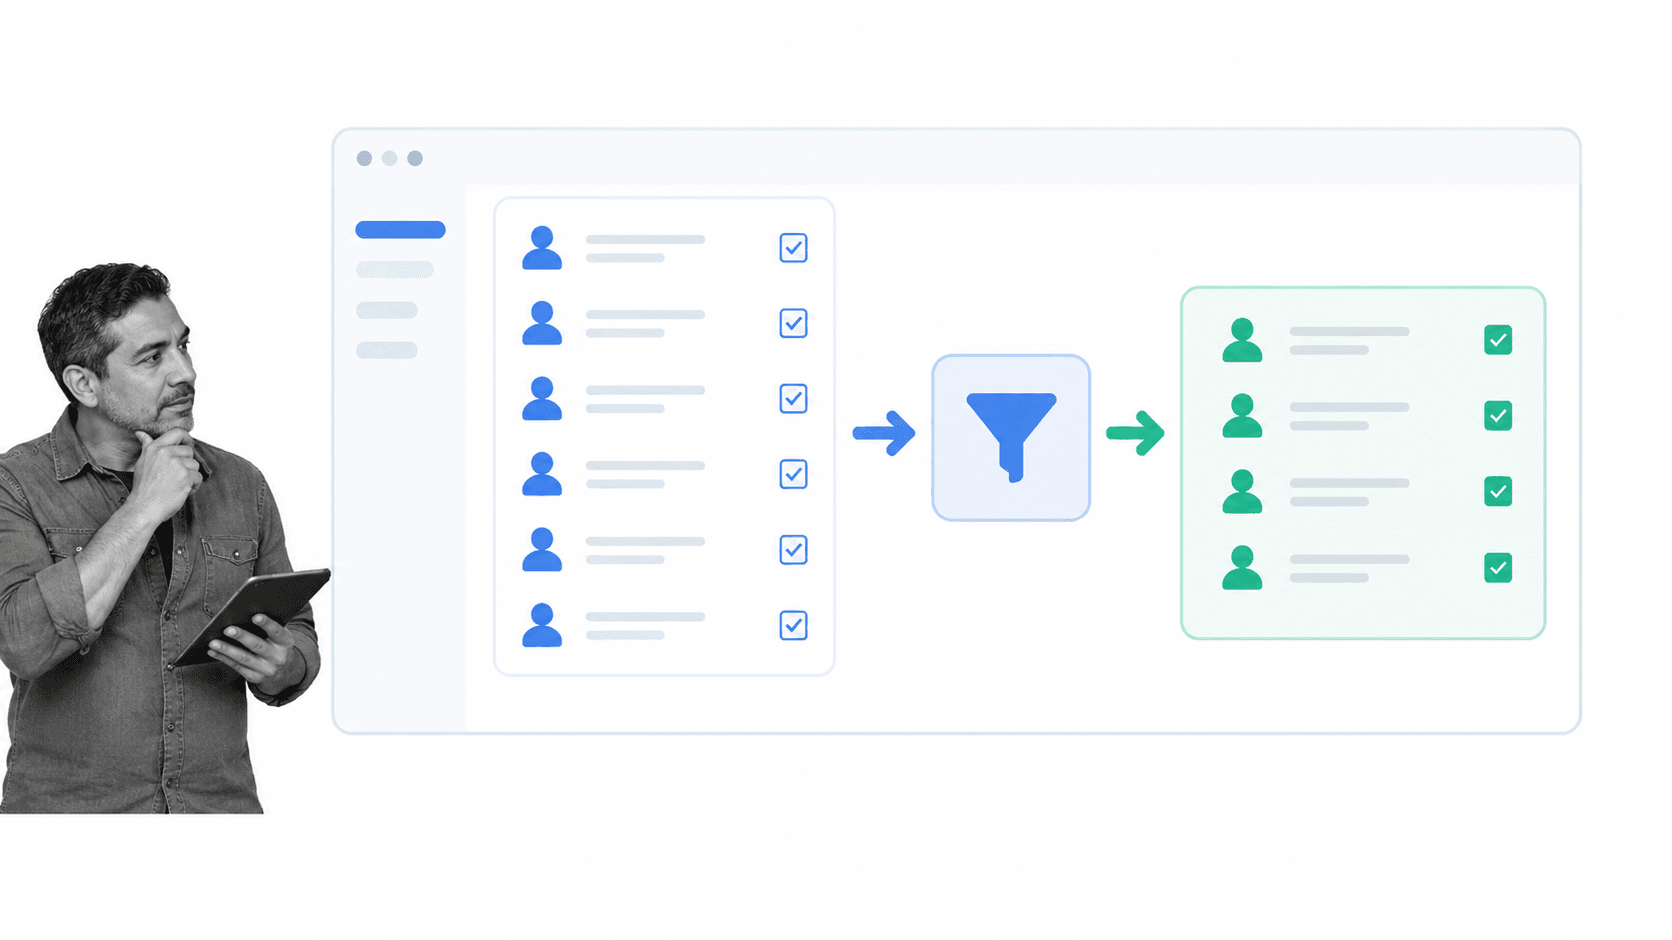
Start by looking for an authoritative source population. Industry directories, public registries, company lists, transparent rankings, and your own permissioned records can all provide a sampling frame. A historical list such as the Montclare SaaS 250 may explain how an older study was assembled, but it should not be presented as a current authority. For startup discovery, AngelList is now known as Wellfound.
Record the source URL, retrieval date, inclusion rule, exclusion rule, and any coverage gaps. A convenient list is not automatically a representative list. If the source overrepresents one country, company size, channel, or time period, disclose that limitation instead of quietly generalizing beyond the sample.
Scraping Google search results
Search can help discover candidates for a study. Precise operators, documented in this guide to Google search tips, can narrow a broad topic to pages with a shared feature. For example, a search for gaming sites that accept contributions could combine a topic with phrases such as “write for us,” “contribute,” or “submit a post.”
Treat those results as a discovery set, not a random sample of the internet. Search results vary by location, personalization, index coverage, and time. Use an approved search-data provider or a documented manual export, respect site terms and rate limits, and save the exact query and collection date. Do not claim that a fixed search-result cap makes the sample complete.
Scraping specific sites with structured extraction

When the facts you need repeat in a consistent page structure, a current extraction service such as Import.io can turn those fields into rows. Before automating, check whether the publisher offers an API, export, or downloadable dataset. That is usually more stable and less error-prone than parsing a page.
Test the extractor against a small, varied group of pages. Compare the exported values with the source pages, note missing fields, and keep the source URL for every row. Layout changes can silently move a value into the wrong column, so validation is part of collection, not a separate optional step. Obtain permission where required and avoid collecting personal or sensitive information that the study does not need.
Exporting content marketing data from BuzzSumo or Ahrefs

BuzzSumo and Ahrefs can help answer questions about content performance and links. You might compare which formats are most cited in a niche, whether list posts attract a different mix of referring domains, or how performance changes by publishing cadence.
Export the fields that correspond to the question rather than every metric available. Document the database, index, filters, market, and export date because third-party indexes differ and change. Link counts and traffic estimates are measurements from a provider, not ground truth. Keep that distinction visible in the methodology.
Collecting data manually in a spreadsheet
Sometimes, like with my SaaS pricing and landing page studies, there is no amount of scraping you can do to get away from the fact that it is a laborious, manual process. For the pricing page study, I visited every URL, took a full-page screenshot, and then manually added the data to a spreadsheet. Open the first image. How many pricing tiers are there? What is the cheapest package? Sometimes this work is insanely manual, but it can pay off.
Manual coding becomes more reliable when you define every field before starting. Create a short codebook with acceptable values and examples. Review the first 10 or 20 records, revise ambiguous definitions, then restart the final pass. If judgments are subjective, have a second person code a sample and compare disagreements.
Exporting social-platform data

The original Twitter support study used the open-source t command-line project. That repository now points to x-cli, and platform access rules have changed. The durable method is to use an authorized export or API, capture only the fields your question requires, and record the query, account set, time window, and collection limit.
Social data is especially sensitive to deleted posts, private accounts, bot activity, and policy changes. Avoid collecting private data, minimize user identifiers, and aggregate findings when individual identity is not relevant. A technically possible collection method is not automatically an ethical or permitted one.
Use automated capture for incoming records

For one study, we signed up to product communications with a dedicated research address so new messages could be recorded as they arrived. A vendor-neutral event-to-table workflow can capture the received time, sender domain, subject category, and source reference into a research table. The same pattern works for permissioned form submissions, RSS items, support events, or files deposited in a controlled folder.
Automation reduces retrospective copying, but it also multiplies mistakes. Test the workflow, retain an immutable source reference, monitor failures, and limit access to the dataset. If the records contain personal data, define a retention period and remove unnecessary identifiers before analysis.
De-clutter your data to make it easy to analyze
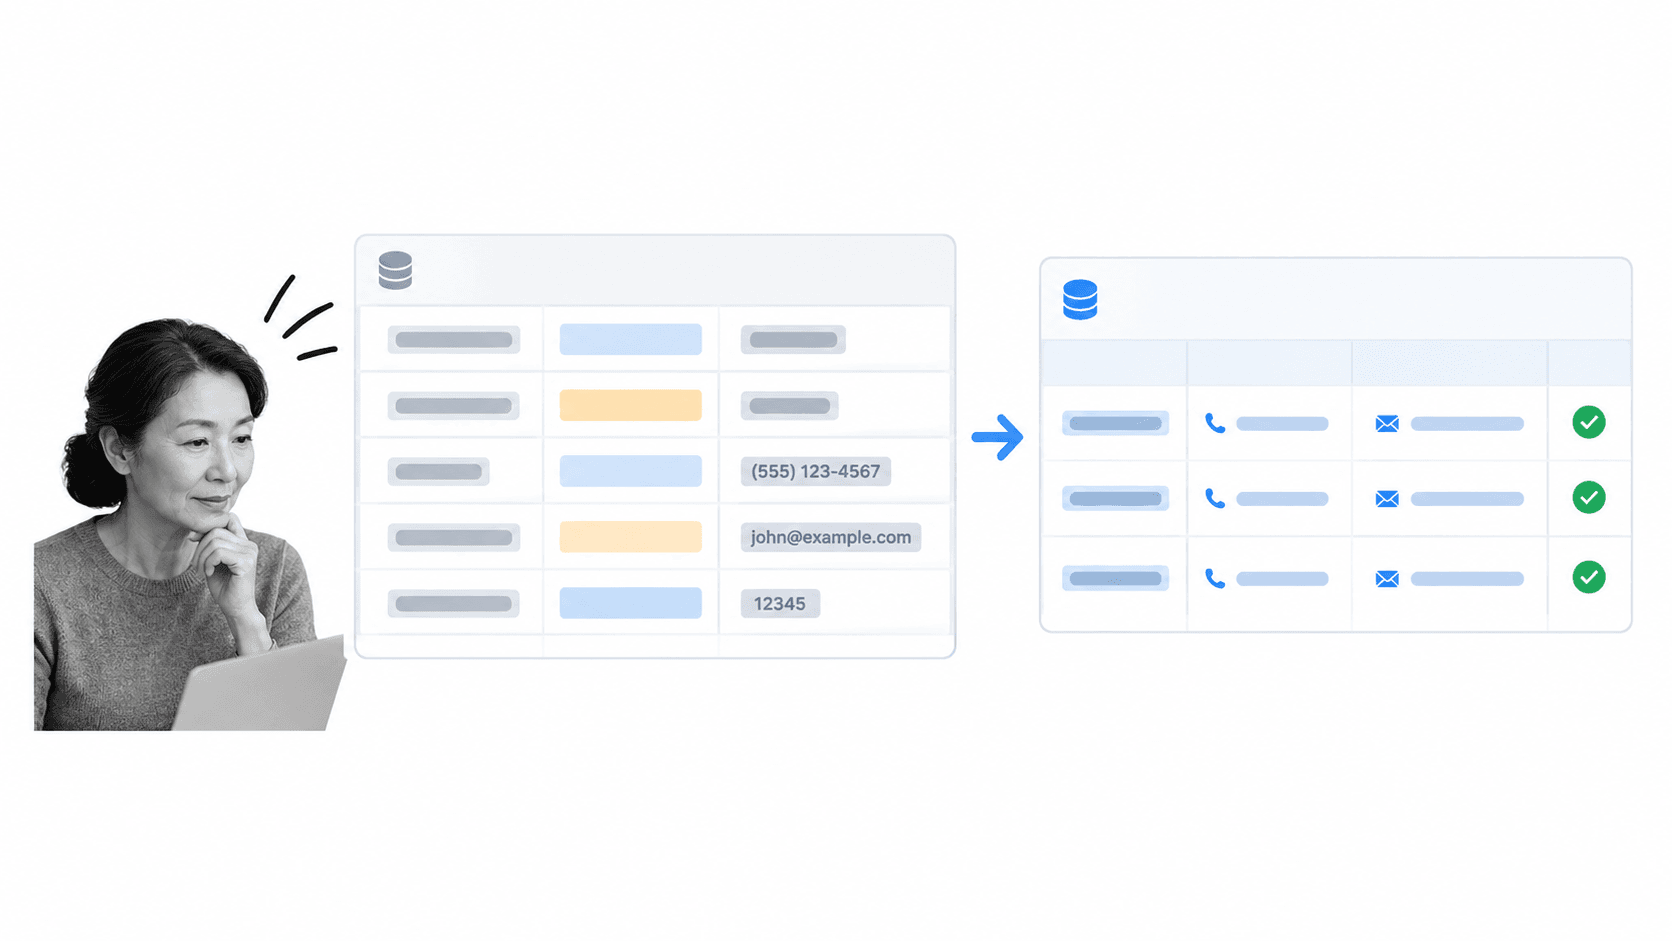
Collected data is rarely ready for analysis. URLs have tracking parameters, company names use different suffixes, dates arrive in mixed formats, and exports contain blank or duplicate rows. Cleaning should make equivalent values comparable without erasing meaningful differences.
Keep three layers: the untouched source export, a cleaned working table, and a log of transformations. That structure makes errors reversible and lets another person reproduce the analysis. Give every record a stable identifier so you can trace a summarized result back to its source.
Using find and replace to tidy messy data

Find and replace is useful for removing a repeated prefix, normalizing a known label, or converting a consistent delimiter. Preview the matches before applying a bulk edit and save the rule you used. For patterns rather than exact strings, a regular expression can help, but test it on a copy and inspect both matched and unmatched rows.
RegexOne provides an approachable way to learn regular expressions. A rule that is too broad can corrupt thousands of rows as quickly as a good rule can clean them, so the goal is not clever syntax. The goal is a small, reviewable transformation.
Manipulating data in a text editor

A capable text editor is useful when a raw export needs line-oriented changes before it reaches a spreadsheet. BBEdit on macOS and Notepad++ on Windows can sort lines, remove matching lines, normalize line endings, change delimiters, and run regular-expression replacements.
With this, you can do all kinds of things:
- Surround lines in quotes.
- Remove all lines that contain certain strings.
- Sort lines numerically or alphabetically.
- Remove line breaks.
- Change commas to line breaks.
- Remove duplicate lines.
Make one transformation at a time. Name the output after the step, count rows before and after, and spot-check values. A visible sequence such as “trim whitespace, normalize case, split domain, then remove empty records” is easier to debug than one giant expression.
Remove duplicate rows in a spreadsheet

Merging sources often creates duplicates. A company may appear under its legal name in one list and a shortened name in another, so exact-row matching is only the first pass. Google Sheets includes native duplicate removal, and most database and spreadsheet tools offer similar controls.
Choose the deduplication key deliberately. Domain name may be stronger than company name; a normalized canonical URL may be stronger than a full tracked URL. Review near-matches instead of merging them automatically. Preserve a record of what was kept, merged, or excluded and why.
Filtering, sorting, and grouping data in Airtable

Airtable can store filtered views and group records by a research field. A view might isolate one company, one sentiment label, or one pricing pattern, then summarize the relevant count. Google Sheets or a database can do the same work; what matters is that the filter corresponds to a declared question.
For example, if I was looking for every company that said “sorry,” “apologies,” or “apologize,” I would filter the main tweet list by tweets that only contain those words, then create a view called “Tweets with apologies.” From inside that view, because the data is not polluted, I could sum the apology count by company and inspect the underlying records.
Automated labels, including AI-assisted classifications, need human validation. Write the classification rubric, test it on a labeled sample, review uncertain cases, and report the model or service used. Do not treat a sentiment score as an observed fact when it is actually an inference.
Finalize the data points you want to look at

It is likely that you had some idea of what you were looking for before you started collecting, but having the full data in front of you will guide you toward more bullet points you might want to examine.
For example, when I had the list of landing page copy in front of me, I realized that it all fell into categories. There were headlines like “the best X software for Y teams,” and each headline had its own sentiment, keywords, and structure.
Before you get to building formulas and organizing the data in a way that helps you draw conclusions, list which conclusions you want to draw. For each question, specify the source field, calculation, comparison group, missing-value rule, and limitation. Separate the original hypothesis from exploratory questions discovered later. Both can be valuable, but readers should be able to tell which was planned.
Extract key findings from your data

Once you are at this stage, you are past the hard part. The hardest part is matching methods of sorting and filtering data to the data points you set out to get. That said, there is no one true way to extract findings.
A lot of the work will be deciding on the best way to filter the data set so you can summarize it. This might mean building formulas into a particular row so you can sum and find percentages, or it might just mean sorting the data so you can find the top records against a certain metric.
For each candidate finding, save the calculation and the denominator. Check outliers, missing records, and alternative explanations. Recalculate a sample by hand. If AI helped categorize text or draft a formula, verify the output against source records and disclose the assistance in the methodology. Report uncertainty honestly, especially when the sample is small or self-selected.
A findings table is useful at this stage. Give each row a short finding, the supporting measure, the sample size, a source link or query, and a confidence or limitation note. That table becomes the bridge between the dataset and the article.
Turn your key findings into content that gets a ton of links and shares

What is the best way to write and structure a study? Show your key data points early so the reader can see the instant value of the post, then dive deeply into each in its own section before drawing a conclusion. Roughly, I use the following structure:
- Introduction: why the question matters, what you studied, and the most important result.
- Key findings: a concise list of the main data points.
- Finding sections: the evidence, context, possible explanations, and limitation for each result.
- Methodology: sources, definitions, collection, cleaning, analysis, and exclusions.
- Conclusion: what the findings imply, what they do not prove, and what a reader can do next.
This is also where a managed content workflow helps. Process Street is a single Compliance Operations Platform with Docs and Ops capability areas plus built-in AI. Teams can document research standards, coordinate reviews, record approvals, and keep evidence attached to the work instead of relying on an improvised chain of messages and spreadsheets.
Create graphs that make the findings easy to understand

A chart should answer one question at a glance. Use bars for clear comparisons, a line for change over time, and a scatterplot for a possible relationship. Avoid three-dimensional effects, truncated axes that exaggerate small differences, and decorative elements that compete with the data.
amCharts, Google Sheets, and Venngage can all produce usable charts. Include a descriptive title, units, source, sample size, and accessible alt text. If a chart needs a long paragraph to decode, simplify it.
Create a slide deck for a concise visual summary
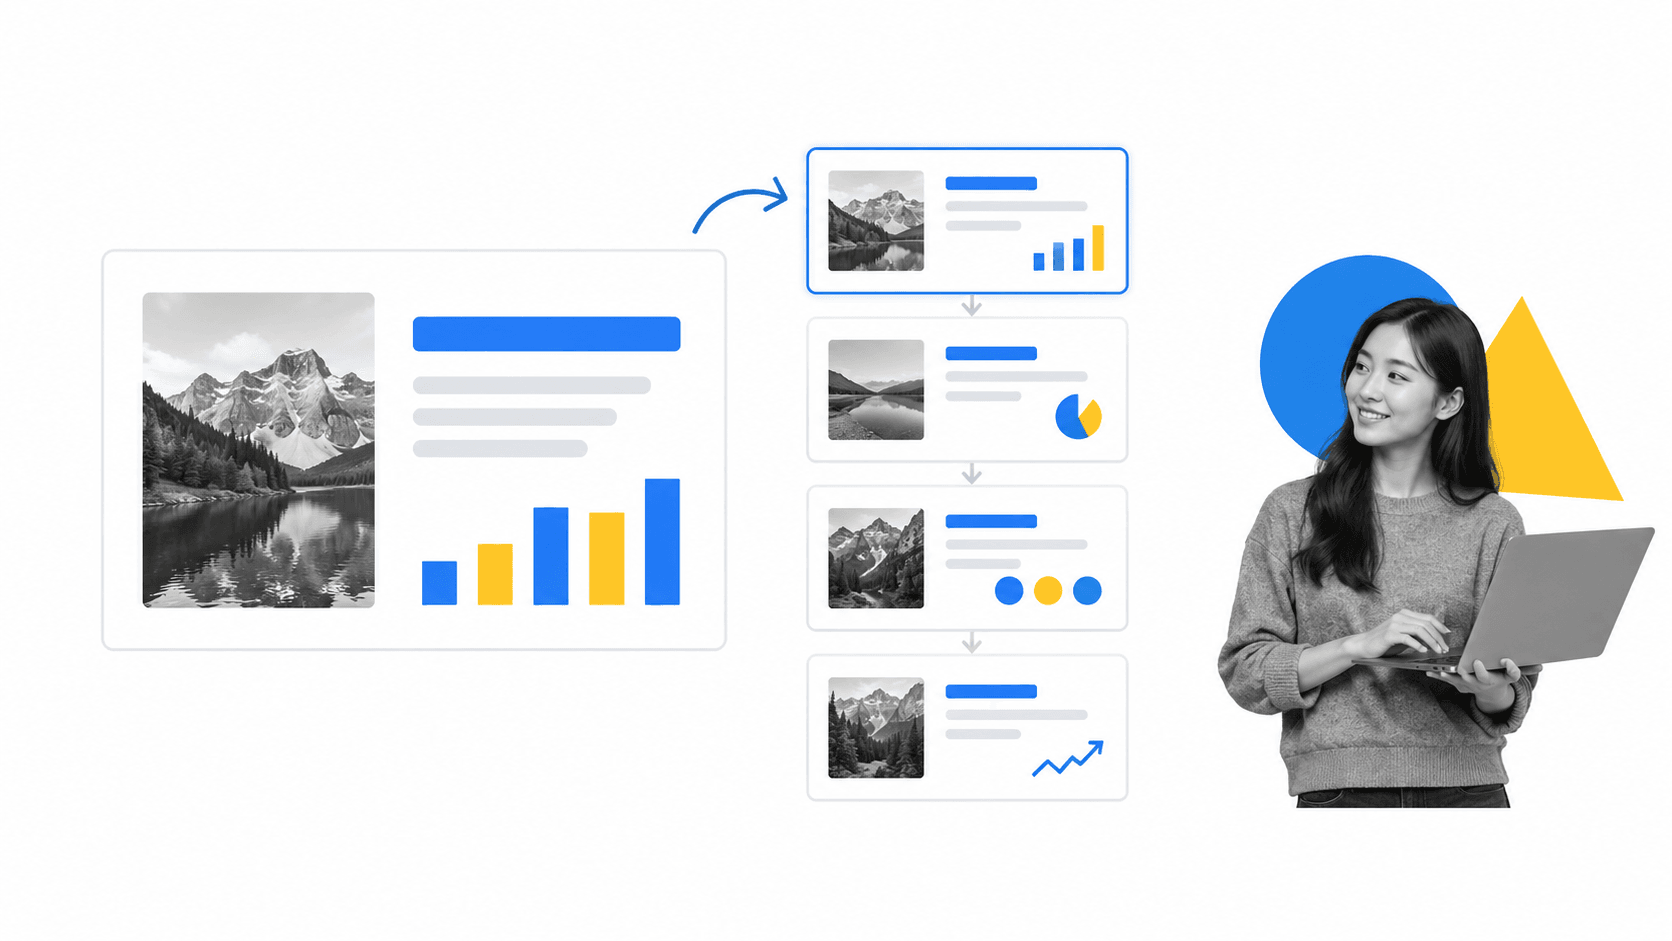
A short deck can help a sales team, executive audience, webinar attendee, or social reader absorb the argument without reading the full article first. Build it from the same evidence: one question, one key finding per slide, a readable chart, a short interpretation, and a final methodology or source slide.
Do not let the deck become a second unsupported version of the study. Keep numbers synchronized with the article and dataset. Link back to the full method so the summary increases reach without stripping away the context required to interpret it.
Create an infographic readers can scan and cite

An infographic can assemble a small set of related findings into a vertical narrative. It works best when the data already has a clear hierarchy: question, sample, three to five findings, implication, and source. It can also be divided into smaller panels for distribution.
Keep labels large, color contrast strong, and decorative illustrations secondary. Never invent precision to make the design symmetrical. Give every statistic enough context to stand alone, and provide a text alternative for readers who cannot use the image.
Be transparent with your methodology

In all of my studies, I try to be as clear as I can about how I obtained the data and why I came to the conclusions I did. For example, in a study about the top 100 health blogs, it is entirely possible that the entire study could be made worthless if the “top” 100 blogs were outdated, inaccurate, or actually just someone’s opinion from an article. For that reason, it is vital to show your methodology.
Your methodology should identify:
- Where the source data came from and when it was collected.
- How the population and sample were defined.
- Which tools, queries, and transformations were used.
- What each label means, including subjective categories such as “negative.”
- What was excluded, missing, estimated, or manually corrected.
- Whether automation or AI assisted collection, classification, analysis, or drafting.
- Which privacy, permission, and retention safeguards were applied.
- The limitations that constrain the result.
For the historical Twitter support study, for example, the method described the company list, the accounts included, the treatment of direct mentions, the export size, and the spreadsheet used for analysis. A current version would also state the platform-access method, collection dates, deleted-content risk, labeling rubric, validation sample, and data-retention policy.
Where you can, publish a data dictionary, an anonymized dataset, the formulas or analysis notebook, and a version number. Reproducibility does not mean exposing personal data or licensed records. It means giving readers enough detail to understand and test the path from source to claim.
Add a content upgrade
A content upgrade is optional supporting material offered alongside the article. Original research naturally creates useful assets: an anonymized spreadsheet, a data dictionary, a checklist, a calculator, a chart pack, or a short deck. The best upgrade helps readers apply or inspect the findings instead of withholding information needed to evaluate them.
The benefits of writing studies are threefold: get visibility from social media shares, improve your SEO by earning backlinks, and collect email subscribers with a useful content upgrade. The cool thing about studies is that you have already done so much of the background work that you have a lot of material to hand.
For my SaaS landing-page copy study, the recurring headline formulas became a spreadsheet readers could adapt. Whatever format you choose, state what it contains, protect any sensitive fields, and keep the download available for as long as the article promises it. A clear research package can extend distribution, earn citations, and support lead generation without turning the article into a gate around its own evidence.
Draw a strong conclusion

I concluded my Twitter support study with a couple of key takeaways for SaaS companies offering support on Twitter, supported by the data I had just spent the whole post explaining. To write a strong conclusion to your study, share what the sum of your findings means to you and what it could mean for other businesses.
State the two or three findings that matter most, explain what they mean for the intended reader, name the main limitation, and suggest the next decision or question. If the evidence surprised you or contradicted the hypothesis, say so. That is one of the advantages of original research: the answer can improve the story instead of being forced to fit it.
The full workflow is straightforward even when the execution is demanding: ask one worthwhile question, define the sample, collect only what you need, preserve the source, clean with an audit trail, validate the analysis, write the findings plainly, and publish the method. That is how data-driven content becomes credible enough to cite and useful enough to remember.
Frequently asked questions about original-data articles
What makes original research useful for content marketing?
It supplies primary evidence that readers and other publishers cannot get from a generic summary. Useful research answers a relevant question, documents the method, and makes its limits visible.
How large should a research sample be?
There is no universal number. The right sample depends on the population, the decision, the expected variation, and the sampling method. Define those constraints before collection and avoid implying that a convenient sample represents everyone.
Can AI help analyze research data?
Yes, but use it as an assisted classification or drafting tool, not an unquestioned source of truth. Test it on labeled examples, review uncertain cases, verify calculations against source records, and disclose material use.
What should a methodology section include?
Include the source population, collection dates, inclusion and exclusion rules, field definitions, tools, cleaning steps, calculations, validation, privacy safeguards, known limitations, and any automation or AI assistance.
The post How I Research & Write an Article Using Irresistible Original Data first appeared on Process Street | Compliance Operations Platform.


0 Commentaires